FXLData
An Excel add-in providing a collection of functions for retrieving statistical data from a Fusion Registry directly into a worksheet
Contents
Quick Start
- Download the latest version File:FXLData beta 0-7-0.zip and unzip the add-in which is a single file: FXLData.xlam
- Install the add in
- Open a blank Excel worksheet
- Paste the following formula into a cell
=fxldata("https://demo.metadatatechnology.com/FusionRegistry","EXR","A")
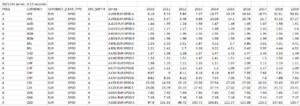
A sample 100 series of annual ECB exchange rates data will be retrieved from Metadata Technology's public demonstration Fusion Registry service and inserted directly into the sheet.
The FXLData Wizard provides a form to help with the task of building FXLData formulas.
Overview
The FXLData family of functions are Excel array formulas.
These work in the same way normal as normal single-cell funcions such as =SUM() and =STDEV() with the exception that the result is an array of series and observation values spanning a range of rows and columns.
Microsoft's documentation provides general information on how to work with array formulas in Excel.
Parameterised functions
These functions take a number of separate arguments making them suitable for building sophisticated data models where Start Period, End Period and other parameters use cell references or Excel formulas.
Both the horizontal and 'V' verical variants take the same arguments making it easy to switch between presentations.
=FXLData( RegUrl , Dataflow , Expression , [MaxSeries] , [RestArguments] , [StartPeriod] , [EndPeriod] , [Labels] , [IncludeHeader] , [IncludeSeriesKey] , [IncludeBreakdown] , [IncludeAttributes] )
Returns a selected dataset in 'horizontal' time-series format with one series per row
- Three mandatory arguments: the base URL of the Fusion Registry, the Dataflow, a Series Key pattern specifying what series to return
- A further nine optional arguments can be specified including: maximum number of series to retrieve, start / end period, labels, headers and whether dimensions and attributes are shown
=FXLDataV( RegUrl , Dataflow , Expression , [MaxSeries] , [RestArguments] , [StartPeriod] , [EndPeriod] , [Labels] , [IncludeHeader] , [IncludeSeriesKey] - ignored, [IncludeBreakdown] - ignored, [IncludeAttributes] )
Returns a selected dataset in 'vertical' format with one series per column
- Three mandatory arguments: the base URL of the Fusion Registry, the Dataflow, a Series Key pattern specifying what series to return
- A further nine optional arguments can be specified including: maximum number of series to retrieve, start / end period, and whether dimensions, attributes and metrics are shown
- IncludeSeriesKey is ignored
- IncludeBreakdown is ignored
- Set Labels=both to show IDs and dimensions / attributes
- If Labels=both, setting IncludeAttributes=TRUE will show the breakdown of series / dataset attributes in the header
- IncludeHeader controls whether the resultset metrics are shown at the top (e.g. 205/1276 series 1.78 seconds)
Examples
=FXLData("https://demo.metadatatechnology.com/FusionRegistry","ECB,EXR,1.0","A...")
=FXLDataV("https://demo.metadatatechnology.com/FusionRegistry","ECB,EXR,1.0","A...",1000,"round=2",2010,2020,"both",true,true,true,false)
=FXLData(C14,C4,C7,C15,C13,C5,C6,C12,C9,C8,C10,C11)
=FXLDataV(A9,B24,B25,1000,,min(D55,2010),max(D56,2020))
Like all Excel functions, arguments can either be literal values, cell references, or other formulas.
Functions taking a Fusion Registry data query URL
These functions take a single fully-formed Fusion Registry data query URL making them suitable for use cases where another tool such as the Fusion Data Browser has been used for data discovery, with data retrieval being performed directly in Excel.
Both the horizontal and 'V' verical variants take the same arguments making it easy to switch between presentations.
=FXLDataUrl( Url , [MaxSeries] )
Returns a selected dataset in 'horizontal' time-series format with one series per row
- Behaves in the same way as =FXLData() but takes a single mandatory argument: a fully-formed Fusion Registry data query URL
- A single optional argument allows the maximum number of series to be set
=FXLDataUrlV( Url , [MaxSeries] )
Returns a selected dataset in 'vertical' format with one series per column
- Behaves in the same way as =FXLDataV() but takes a single mandatory argument: a fully-formed Fusion Registry data query URL
- A single optional argument allows the maximum number of series to be set
Examples
=FXLDataUrl("https://demo.metadatatechnology.com/FusionRegistry/ws/public/sdmxapi/rest/data/ECB,EXR,1.0/A.CAD+HUF+INR...E?round=2&labels=id")
=FXLDataUrlV("https://demo.metadatatechnology.com/FusionRegistry/ws/public/sdmxapi/rest/data/ECB,EXR,1.0/A.CAD+HUF+INR...E?round=2&labels=id",1000)
Administrative functions
=FXLDataVersion()
- Returns the software version number and build date
Microsoft 365 Excel 2018 and later
In Microsoft 365 versions of Excel, the FXLData functions act as dynamic array formulas which populate or 'spill' the result set into neighbouring cells on execution. There is no need for an explicit refresh because Excel will 'recalculate' any FXLData functions that have changed using its normal worksheet calculation behaviour. Settings Excel's calculation options to Automatic (the default) will automatically refresh an FXLData formula if the formula or something it depends upon such as a parameter in referenced cell has changed. If calculation is set to Manual, changed FXLData formulas will be refreshed when the user asks Excel to perform a recalculation using the Calculate Now or Calculate Sheet buttons on the ribbon bar. A complete recalculation can be forced using CTRL+ALT+SHIFT+F9.
Office 2010-2019 Excel
For these older versions of Excel which do not support dynamic array formulas, the FXLData functions work in legacy mode which emulates to some extent the dynamic array formula behaviour. On execution, the result set still populates into neighbouring cells. However, there are some important differences between legacy mode and proper dynamic arrays:
- In legacy mode, the result set is written directly into the worksheet which Excel treats as a collection of largely disconnected cells. By contrast, Excel treats a dynamic array as a single entity.
- Excel automatically protects against dyanamic arrays overwriting other content in the worksheet resulting in a #Spill! error if that would otherwise occur. Legacy mode will overwrite any existing content meaning that care is required to avoid worksheet corruption if the result set from an FXLData function is larger than expected.
- Legacy mode FXLData functions will be automatically refreshed if the formula itself is changed, but it not if a dependency of the formula changes. This is because the legacy mode refresh only emulates the proper dynamic array formuala spill behaviour.
FXLData Wizard
The FXLData Wizard is an Excel ribbon bar tool for interactively building and editing FXLData functions and comes as part of the add in.
Prerequisites
- Fusion Registry 10.7.0 or later
- Microsoft 365 Excel 2018 or later - supports dynamic arrays which automatically 'spill' the result set into the worksheet
- Office 2010-2019 - FXLData functions operate in legacy mode which provides dynamic array emulation
Refer to Microsoft's documentation on dyanmic arrays and legacy 'ctrl-shift-enter' behavior.
Excel on Apple Mac is not supported because FXLData uses operating system services only available on Windows.
Installation
The FXLData add-in is distributed as a single Excel file:
FXLData.xlam
There are two installation options.
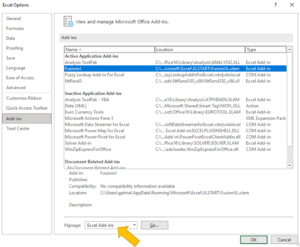
Option 1: Excel Add-ins manager
- From the Excel File menu, choose Options
- On the Options popup, choose Add-ins from the list
- At the bottom, choose Excel Add-ins from the 'Manage' list and click Go
- On the Add-ins popup, choose Browse and select the FXLData.xlam distribution file
Option 2: Excel XLSTART directory
- Copy the FXLData.xlam to the Excel XLSTART directory which is usually in the following location C:\Users\<username>\AppData\Roaming\Microsoft\Excel\XLSTART
Function Reference
=FXLData()
By default ƒx =FXLData() returns a horizontal time-series dataset, one series per row with time spanning the columns i.e. time is the dimension at observation. A different dimension at observation can be chosen using the RestAuguments parameter - refer to the guidance below.
Use Case
This parameterised form is suitable for hand coding in a spreadsheet. Like all Excel functions, the arguments can be literal values, cell references or Excel expressions allowing the creation of complex data models. In its simplest form, only three arguments are required:
- The 'base URL' of the Fusion Registry to connect to
- The ID of the Dataflow
- A series key specifying which series to retrieve, or simply 'all' to retrieve all series
=FXLData("https://demo.metadatatechnology.com/FusionRegistry","EXR","all")
By default, the number of series returned is capped at 100, but can be altered using the MaxSeries argument
Syntax
=FXLData( RegUrl , Dataflow , Expression , [MaxSeries] , [RestArguments] , [StartPeriod] , [EndPeriod] , [Labels] , [IncludeHeader] , [IncludeSeriesKey] , [IncludeBreakdown] , [IncludeAttributes] )
| Argument | Description | Examples | Required? | |
|---|---|---|---|---|
| 1 | RegUrl | The base URL of the Fusion Registry service | https://demo.metadatatechnology.com/FusionRegistry | Mandatory |
| 2 | Dataflow | Options: 1. The dataflow to query conforming to the SDMX REST specification for data queries 2. A blank string - in this case the Dataflow(s) to query must be specified as part of the Expression. |
EXR ECB,EXR,1.0 |
Mandatory |
| 3 | Expression | Options: 1. A series key 2. A dataflow and series key expression <dataflow>/<series key> 3. A JSON series basket expression which must be a cell reference and cannot be a literal value 4. The keyword 'all' to select all series in the dataset |
A A.CAD+HUF+INR...E all ECB,EXR,1.0/A.HUF...E C4 (cell reference) |
Mandatory |
| 4 | MaxSeries | The maximum number of series to return | 1000 | Optional Defaults to 100 series |
| 5 | RestArguments | Additional data REST query arguments intended for special use cases like adding calculated measures or changing the dimension at observation | round=3&calculatemeasure=THE_MEASURE;pch;mvavg,3&dimensionAtObservation=CURRENCY_DENOM | Optional |
| 6 | StartPeriod | The start period in SDMX standard time format | 2010-06-12 2010 |
Optional Defaults to the start of the available data |
| 7 | EndPeriod | The end period in SDMX standard time format | 2010-06-12 2010 |
Optional Defaults to the end of the available data |
| 8 | Labels | Component labelsid - IDs onlyname - names onlyboth - both IDs and names |
both | Optional Defaults to id
|
| 9 | IncludeHeader | BooleanTRUE includes component labels at the head of each column and shows metricsFALSE component labels and metrics are ommitted |
FALSE | Optional Defaults to TRUE
|
| 10 | IncludeSeriesKey | BooleanTRUE adds a calculated dimension 'series' with the series key as the valueFALSE series keys are not included in the dataset |
FALSE | Optional Defaults to TRUE
|
| 11 | IncludeBreakdown | Boolean Controls whether a breakdown of the dataset's components is shown. TRUE includes dimensions. Attributes are also shown if the IncludeAttributes argument is TRUE. FALSE no components are included |
TRUE | Optional Defaults to TRUE
|
| 12 | IncludeAttributes | BooleanTRUE includes series attributes in the component breakdownFALSE excludes attributes |
FALSE | Optional Defaults to TRUE
|
=FXLDataUrl()
By default ƒx =FXLDataUrl() returns a horizontal time-series dataset. Time is the dimension at observation by default resulting in one series per row with time periods spanning the columns. A different dimension at observation can be chosen by adding a REST argument to the URL - refer to the guidance below.
Use Case
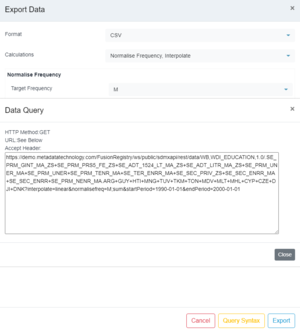
This version of the function is designed primarily for use cases where a data query URL is generated by a data discovery tool, for example:
- The Fusion Registry REST Web Service query builder
- The Fusion Data Browser Export Data Query Syntax function
Syntax
=FXLDataUrl( Url , [MaxSeries] )
| Argument | Description | Examples | Required? | |
|---|---|---|---|---|
| 1 | Url | A complete and fully-formed SDMX data query URL | https://demo.metadatatechnology.com/FusionRegistry/ws/public/sdmxapi/rest/data/ECB,EXR,1.0/A.CAD+HUF+INR...E?round=2&labels=id | Mandatory |
| 2 | MaxSeries | The maximum number of series to return | 1000 | Optional Defaults to 100 series |
=FXLDataV()
By default ƒx =FXLDataV() returns a vertical dataset, one series per column with time spanning the rows. The dimension at observation cannot be changed, the REST argument, if set is ignored.
Use Case
This parameterised form is suitable for hand coding in a spreadsheet. Like all Excel functions, the arguments can be literal values, cell references or Excel expressions allowing the creation of complex data models. In its simplest form, only three arguments are required:
- The 'base URL' of the Fusion Registry to connect to
- The ID of the Dataflow
- A series key specifying which series to retrieve, or simply 'all' to retrieve all series
=FXLDataV("https://demo.metadatatechnology.com/FusionRegistry","EXR","all")
By default, the number of series returned is capped at 100, but can be altered using the MaxSeries argument
Syntax
=FXLDataV( RegUrl , Dataflow , Expression , [MaxSeries] , [RestArguments] , [StartPeriod] , [EndPeriod] , [Labels] , [IncludeHeader] , [IncludeSeriesKey] , [IncludeBreakdown] , [IncludeAttributes] )
| Argument | Description | Examples | Required? | |
|---|---|---|---|---|
| 1 | RegUrl | The base URL of the Fusion Registry service | https://demo.metadatatechnology.com/FusionRegistry | Mandatory |
| 2 | Dataflow | Options: 1. The dataflow to query conforming to the SDMX REST specification for data queries 2. A blank string - in this case the Dataflow(s) to query must be specified as part of the Expression. |
EXR ECB,EXR,1.0 |
Mandatory |
| 3 | Expression | Options: 1. A series key 2. A dataflow and series key expression <dataflow>/<series key> 3. A JSON series basket expression which must be a cell reference and cannot be a literal value 4. The keyword 'all' to select all series in the dataset |
A A.CAD+HUF+INR...E all ECB,EXR,1.0/A.HUF...E C4 (cell reference) |
Mandatory |
| 4 | MaxSeries | The maximum number of series to return | 1000 | Optional Defaults to 100 series |
| 5 | RestArguments | Additional data REST query arguments intended for special use cases like adding calculated measures or changing the dimension at observation | round=3&calculatemeasure=THE_MEASURE;pch;mvavg,3&dimensionAtObservation=CURRENCY_DENOM | Optional |
| 6 | StartPeriod | The start period in SDMX standard time format | 2010-06-12 2010 |
Optional Defaults to the start of the available data |
| 7 | EndPeriod | The end period in SDMX standard time format | 2010-06-12 2010 |
Optional Defaults to the end of the available data |
| 8 | Labels | Component labelsid - IDs onlyboth - both IDs and names |
both | Optional Defaults to id
|
| 9 | IncludeHeader | BooleanTRUE shows resultset metrics (e.g. 108/1256 series 2.15 seconds)FALSE metrics are omitted |
FALSE | Optional Defaults to TRUE
|
| 10 | IncludeSeriesKey | Ignored | Optional Ignored | |
| 11 | IncludeBreakdown | Ignored | Optional Ignored | |
| 12 | IncludeAttributes | BooleanTRUE includes series attributes if labels=bothFALSE excludes attributes |
FALSE | Optional Defaults to TRUE
|
=FXLDataUrlV()
ƒx =FXLDataUrlV() returns a vertical dataset, one series per column with time spanning the rows. The dimension at observation cannot be changed, the REST argument, if set is ignored.
Use Case
This version of the function is designed primarily for use cases where a data query URL is generated by a data discovery tool, for example:
- The Fusion Registry REST Web Service query builder
- The Fusion Data Browser Export Data Query Syntax function
Syntax
=FXLDataUrlV( Url , [MaxSeries] )
| Argument | Description | Examples | Required? | |
|---|---|---|---|---|
| 1 | Url | A complete and fully-formed SDMX data query URL | https://demo.metadatatechnology.com/FusionRegistry/ws/public/sdmxapi/rest/data/ECB,EXR,1.0/A.CAD+HUF+INR...E?round=2&labels=id | Mandatory |
| 2 | MaxSeries | The maximum number of series to return | 1000 | Optional Defaults to 100 series |
=FXLDataVersion()
ƒx =FXLDataUrlV() returns the version number of the FXLData addin.
Syntax
=FXLDataVersion()
Example
=FXLDataVersion()
Returns 1.3.2 18/12/2021
Legacy Mode
Legacy Mode emulates the latest Microsoft 365 dynamic array behaviour in older Office Excel 2010-2019 versions by populating the cells neighbouring that holding an FXLData formula with the data result set.
In versions of Microsoft 365 Excel that do support dynamic arrays, legacy mode can also be used to write the result set directly into the worksheet. That's useful in situations where discrete data points are needed rather than an Excel array which has certain limitations.
Office Excel 2010-2019
FXLData always works in legacy mode when using Office Excel 2010-2019.
When an FXLData function is executed, the first cell of the result set will appear as the formula result. If automatic calculation is enabled, FXLData's dynamic array emulation will immediately populate the neighbouring cells with the remainder of the result set. If automatic calculation is disabled, Refresh must be used.
Forcing Microsoft 365 Excel to use Legacy Mode
FXLData functions in Microsoft 365 Excel operate as dynamic array formulas by default where the result set appears in the worksheet as an Excel array.
Using the Implicit intersection operator: @ however forces the FXLData function to operate in legacy mode causing the result set to be written directly into the worksheet.
=@FXLData("https://registry.domain.org/FusionRegistry","ECB,EXR,1.0","A..BGN+BEF..",100,"round=2","2010","2020","id",TRUE,FALSE,TRUE,FALSE)
In the above example the @ preceeding the FXLData function name instructs Excel to return the implicit intersection of the result set array which is just the first cell. If legacy mode automatic calculation is enabled, the FXLData's dynamic array emulation will populate the neighbouring cells. If not, Refresh must be used.
Refresh
Microsoft 365 Excel and dynamic array formulas
Interactive
FXLData functions by default work as dynamic array formulas in Microsoft 365 so are refreshed using the normal Excel calculation rules:
Refresh occurs when:
- a change is made to the formula
- a change is made to something the formula depends upon such as an argument value held in another cell
- Excel is forced to recalculate open workbooks using
CTRL+ALT+F9orCTRL+ALT+SHIFT+F9 - a saved workbook is opened
![]() The Refresh options on the FXLData ribbon do not refresh dynamic array formulas.
The Refresh options on the FXLData ribbon do not refresh dynamic array formulas.
From Code
Refreshing FXLData from VBA, C# or C code uses the standard Excel API calculation functions, for instance:
- VBA: ActiveSheet.Calculate
- C API: xlcCalculateDocument()
Office 2010-2019 Excel and Microsoft 365 Excel working in legacy Mode
Interactive
In older versions of Office Excel and when forcing legacy mode in Microsoft 365 using the @ implicit intersection operator, FXLData functions can be manually refreshed using the Refresh options on the ribbon bar.
- Refresh Selected: refreshes the FXLData function at the current active cell
- Refresh Sheet: refreshes all FXLData functions on the current work sheet
- Refresh Book: refreshes all FXLData functions in the work book
From Code
The FXLData add-in exposes three public sub-routines to trigger a refresh from VBA code.
![]() A reference to FXLDataAddin must be added to the VBA project.
A reference to FXLDataAddin must be added to the VBA project.
Macro Example 1 - Refresh the FXLData function in the current active cell
Public Sub myMacro()
   FXLDataRefreshActiveCell
End Sub
Macro Example 2 - Refresh all FXLData functions in the workbook
Public Sub myMacro()
   FXLDataRefreshWorkbook
End Sub
Macro Example 3 - Refresh all FXLData functions in the current sheet
Public Sub myMacro()
   FXLDataRefreshSheet
End Sub
Macro Example 4 - Refresh the FXLData function in the specified cell
Public Sub myMacro()
   FXLDataRefreshCell Range("C4")
End Sub
Dimension at Observation
For horizontal presentation functions, the dimension at observation defaults to time but can be changed using the dimensionAtObservation REST argument.
REST Argument Syntax
dimensionAtObservation=<DIMENSION_ID> | AllDimensions
Behaviour
| Value | Behaviour | Example |
|---|---|---|
| <DIMENSION_ID> | Using the ID of any other dimension in the dataset will cause the observations to be broken down by that dimension which will appear across the columns | dimensionAtObservation=REF_AREA |
| TIME_PERIOD | The same as the default behaviour where time is the dimension at observation | (dimensionAtObservation argument is ommitted) |
| AllDimensions | Setting the dimension at observation to the special value AllDimensions generates a result set with a single row per observation | dimensionAtObservation=AllDimensions |
Examples
Setting REF_AREA as the dimension at observation
=FXLDataUrl("https://demo.metadatatechnology.com/FusionRegistry/ws/public/sdmxapi/rest/data/WB,GCI,1.0/GBR?labels=id&round=1&dimensionAtObservation=REF_AREA")
AllDimensions - the result is precisely one observation per row
=FXLDataUrl("https://demo.metadatatechnology.com/FusionRegistry/ws/public/sdmxapi/rest/data/WB,GCI,1.0/GBR?labels=id&round=1&dimensionAtObservation=AllDimensions")
Default behaviour with time as the dimension at observation
=FXLDataUrl("https://demo.metadatatechnology.com/FusionRegistry/ws/public/sdmxapi/rest/data/WB,GCI,1.0/GBR?labels=id&round=1")
Choosing Attributes to Include in the Resultset
A breakdown of some or all series attributes can be returned as part of the resultset if required. Note that dataset and observation-level attributes are not available.
Include all attributes
- =FXLData() horizontal presentation: set includeBreakdown=TRUE and includeAttributes=TRUE
- =FXLDataV() vertical presentation: set labels=both and includeAttributes=TRUE
Include selected attributes
- Set includeBreakdown=TRUE for =FXLData() or labels=both for =FXLDataV()
- Add to the REST Args: attributes= followed by a comma-separated list of the attribute IDs to include. e.g.
attributes=UNIT,TITLE
Worked examples
The following are samples from the ECB's EXR (Exchange Rates) dataset:
Include all attributes using horizontal presentation.
=FXLData("https://demo.metadatatechnology.com/FusionRegistry","EXR","A",100,,"1990","1995","id",True,True,True,True)
Include all attributes using vertical presentation.
=FXLDataV("https://demo.metadatatechnology.com/FusionRegistry","EXR","A",100,,"1990","1995","both",True,True,True,True)
Include just the UNIT and TITLE attributes using horizontal presentation.
=FXLData("https://demo.metadatatechnology.com/FusionRegistry","EXR","A",100,"attributes=UNIT,TITLE","1990","1995","id",True,True,True,True)
Include just the UNIT and TITLE attributes using vertical presentation.
=FXLDataV("https://demo.metadatatechnology.com/FusionRegistry","EXR","A",100,"attributes=UNIT,TITLE","1990","1995","both",True,True,True,True)
Fusion Registry Authentication
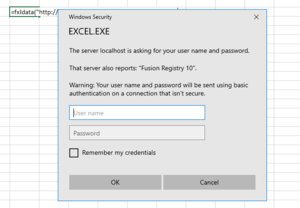
Excel will automatically request the user to authenticate when executing and FXLData function where the Fusion Registry data source is operating in private mode.
Points to note:
- Excel will remember authentication details provided for the remainder of the session. Close and reopen Excel if you need to re-authenticate as a different user.
- A spread sheet can contain multiple FXLData functions using different Fusion Registries. Excel will ask for separate authentication details for each Fusion Registry, thus it is possible to connect to Fusion Registry A as user X, and Fusion Registry B as user Y.
- No authentication will be requested if a Fusion Registry is operating in public mode.
![]() There is no way to force FXLData to authenticate as a particular user if the Fusion Registry is operating in public mode but also allows authenticated users with additional data access privileges. Fusion Registry administrators should consider switching to private mode as a work-around.
There is no way to force FXLData to authenticate as a particular user if the Fusion Registry is operating in public mode but also allows authenticated users with additional data access privileges. Fusion Registry administrators should consider switching to private mode as a work-around.
Resultset Metrics
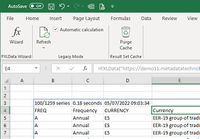
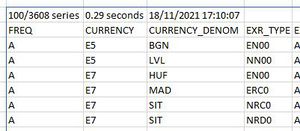
Metrics are shown in the first row of the result set if headers are enabled.
Series Count
100/3608 series
<base series retrieved>/<base series available> series
- <base series retrieved> is the number of base series retrieved before any calculated measures are added or aggregations performed.
- <base series available> is the total number of base series available for the query.
The effect of calculated measures
If the query includes calculated measures such as percentage change or moving average, the actual number of series retrieved will be higher than the reported base series. The actual number of series in the result set can generally be calculated as:
<base series retrieved> * (1 + <number of calculated measures>)
Note that this formula does not hold true when combining aggregations with calculated measures.
The effect of aggregations
Aggregations reduce the number of series retrieved due to the removal of one or more dimensions. Thus, the series retrieved will be lower than the reported base series.
Function Execution Time
0.29 seconds
<execution time> seconds
The actual time the function took to retrieve the data from the Fusion Registry and return the result set to Excel.
Resultset freshness timestamp
18/11/2021 17:10:07
<date time>
The date and time the resultset was last refreshed from the Fusion Registry data source.
Controlling when metrics are displayed
For parameterised functions (=FXLData() and =FXLDataV()), metrics are displayed when the IncludeHeader argument is TRUE. Set to FALSE to omit metrics.
For URL functions (=FXLDataUrl() and =FXLDataUrlV()), metrics are displayed if the REST API parameter excludeHeader=false. Set the parameter to excludeHeader=true to omit metrics.
Troubleshooting
The FXLData addin disappears or fails to load
A possible cause is Windows security settings blocking the FXLData.xlam file as it has originated from another computer. The following YouTube video provides details on how to solve the problem: https://www.youtube.com/watch?v=AhnOU-ulqNg
