Difference between revisions of "FXLData"
(→Administrative functions) |
(→Overview) |
||
| Line 3: | Line 3: | ||
The FXLData family of functions work like normal Excel formulas with the exception that the result is an ''array'' of series and observation values spanning multiple rows and columns. This behaviour differs from functions such as =sum() and =average() that return a single value into the cell containing the formula. Microsoft's [https://support.microsoft.com/en-us/office/guidelines-and-examples-of-array-formulas-7d94a64e-3ff3-4686-9372-ecfd5caa57c7 documentation] provides general information on how that these ''array formulas'' work. | The FXLData family of functions work like normal Excel formulas with the exception that the result is an ''array'' of series and observation values spanning multiple rows and columns. This behaviour differs from functions such as =sum() and =average() that return a single value into the cell containing the formula. Microsoft's [https://support.microsoft.com/en-us/office/guidelines-and-examples-of-array-formulas-7d94a64e-3ff3-4686-9372-ecfd5caa57c7 documentation] provides general information on how that these ''array formulas'' work. | ||
| − | ====Functions | + | ====Functions horizontal (time-series) presentation==== |
Returns a selected dataset in time-series format with one series per row | Returns a selected dataset in time-series format with one series per row | ||
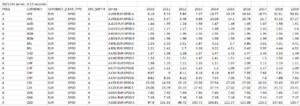
[[File:Fxldata example1.PNG|thumb|Horizontal time-series example]] | [[File:Fxldata example1.PNG|thumb|Horizontal time-series example]] | ||
Revision as of 12:48, 7 September 2021
An Excel addin providing a collection of functions for retrieving statistical data from a Fusion Registry directly into a worksheet.
Contents
Overview
The FXLData family of functions work like normal Excel formulas with the exception that the result is an array of series and observation values spanning multiple rows and columns. This behaviour differs from functions such as =sum() and =average() that return a single value into the cell containing the formula. Microsoft's documentation provides general information on how that these array formulas work.
Functions horizontal (time-series) presentation
Returns a selected dataset in time-series format with one series per row
=FXLData()
- The function has three mandatory arguments: the base URL of the Fusion Registry, the Dataflow, a Series Key pattern specifying what series to return
- A further nine optional arguments can be specified including: maximum number of series to retrieve, start / end period, labels, headers and whether dimensions and attributes are shown
Examples
=FXLData("https://demo.metadatatechnology.com/FusionRegistry","ECB,EXR,1.0","A...")
=FXLData("https://demo.metadatatechnology.com/FusionRegistry","ECB,EXR,1.0","A...",1000,"round=2",2010,2020,both,true,true,true,false)
=FXLData(C14,C4,C7,C15,C13,C5,C6,C12,C9,C8,C10,C11)
Like all Excel functions, arguments can either be literal values, cell references, or other formulas.
=FXLDataUrl()
- Behaves the same as =FXLData() but takes a single mandatory argument: a fully-formed Fusion Registry data query URL
- A single optional argument allows the maximum number of series to be set
Examples
=FXLDataUrl("https://demo.metadatatechnology.com/FusionRegistry/ws/public/sdmxapi/rest/data/ECB,EXR,1.0/A.CAD+HUF+INR...E?round=2&labels=id")
=FXLDataUrl("https://demo.metadatatechnology.com/FusionRegistry/ws/public/sdmxapi/rest/data/ECB,EXR,1.0/A.CAD+HUF+INR...E?round=2&labels=id",1000)
Functions for vertical presentation
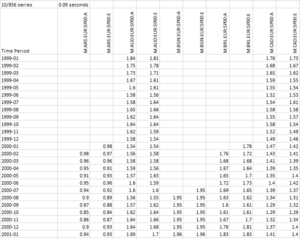
Returns a selected dataset with one series per column and time on the rows.
=FXLDataV()
- Like its horizontal counterpart, FXLDataV has three mandatory arguments: the base URL of the Fusion Registry, the Dataflow, a Series Key pattern specifying what series to return
- There are a further seven optional arguments for controlling: the maximum number of series to retrieve, start / end period, labels, header behaviour and whether attributes are shown
- REST API data query arguments can also be given for special operations like number precision and calculated measures (e.g. % change)
Examples
=FXLDataV("https://demo.metadatatechnology.com/FusionRegistry","ECB,EXR,1.0","A...")
=FXLDataV(("https://demo.metadatatechnology.com/FusionRegistry","ECB,EXR,1.0","A...",1000,"calculatemeasure=CALC_MEASURE;pch;mvavg,3",2010,2020,id,false,false)
=FXLDataV(C13,C3,C6,C14,C12,C4,C5,C11,C8,C10)
=FXLDataUrlV()
- Behaves the same as =FXLDataV() but takes a single mandatory argument: a fully-formed Fusion Registry data query URL
- A single optional argument allows the maximum number of series to be set
Examples
=FXLDataUrlV("https://demo.metadatatechnology.com/FusionRegistry/ws/public/sdmxapi/rest/data/ECB,EXR,1.0/A.CAD+HUF+INR...E?round=2&labels=id")
=FXLDataUrlV("https://demo.metadatatechnology.com/FusionRegistry/ws/public/sdmxapi/rest/data/ECB,EXR,1.0/A.CAD+HUF+INR...E?round=2&labels=id",1000)
Administrative functions
=FXLDataVersion()
- Returns the software version number
Function Reference
=FXLData()
By default ƒx =FXLData() returns a horizontal time-series dataset, one series per row with time spanning the columns i.e. time is the dimension at observation. A different dimension at observation can be chosen, more information on how to do this is given in the 'Dimension at Observation behaviour' paragraph below.
Syntax
=FXLData( RegUrl , Dataflow , Expression , [MaxSeries] , [RestArguments] , [StartPeriod] , [EndPeriod] , [Labels] , [IncludeHeader] , [IncludeSeriesKey] , [IncludeBreakdown] , [IncludeAttributes] )
| Argument | Description | Examples | Required? | |
|---|---|---|---|---|
| 1 | RegUrl | The base URL of the Fusion Registry service | https://demo.metadatatechnology.com/FusionRegistry | Mandatory |
| 2 | Dataflow | The Dataflow to query conforming to the SDMX REST specification for data queries | ECB,EXR,1.0 | Mandatory |
| 3 | Expression | A series key pattern defining the series to select | A.CAD+HUF+INR...E | Mandatory |
| 4 | MaxSeries | The maximum number of series to return | 1000 | Optional Defaults to 100 series |
| 5 | RestArguments | Additional data REST query arguments intended for special use cases like adding calculated measures or changing the dimension at observation | round=3&calculatemeasure=THE_MEASURE;pch;mvavg,3&dimensionAtObservation=CURRENCY_DENOM | Optional |
| 6 | StartPeriod | The start period in SDMX standard time format | 2010-06-12 2010 |
Optional Defaults to the start of the available data |
| 7 | EndPeriod | The end period in SDMX standard time format | 2010-06-12 2010 |
Optional Defaults to the end of the available data |
| 8 | Labels | Component labelsid - IDs onlyname - names onlyboth - both IDs and names |
both | Optional Defaults to id
|
| 9 | IncludeHeader | BooleanTRUE includes component labels at the head of each column and shows metricsFALSE component labels and metrics are ommitted |
FALSE | Optional Defaults to TRUE
|
| 10 | IncludeSeriesKey | BooleanTRUE adds a calculated dimension 'series' with the series key as the valueFALSE series keys are not included in the dataset |
FALSE | Optional Defaults to TRUE
|
| 11 | IncludeBreakdown | BooleanTRUE includes dimensions FALSE excludes dimensions |
FALSE | Optional Defaults to TRUE
|
| 12 | IncludeAttributes | BooleanTRUE includes dataset and series-level attributesFALSE excludes attributes |
FALSE | Optional Defaults to TRUE
|

