Data Browser Configuration
Contents
Overview
Fusion Data Browser contains a number of Configuration files, which are under the dist/properties folder. The configuration files are:
- siteconfig.json Defines where the API to obtain data and metadata from. Configure high level display information
- seriesconfig.json Defines how to display the Series List
- exportconfig.json Defines what export formats and export parameters to offer the user when downloading datasets
- chartconfig.json Defines the default display for the time series chart
- browser_lang_[locale].json Contains the human readable labels used in the User Interface, additional translations can be provided for alternative languages
Site Configuration
The siteconfig.json file contains the following properties:
| Property | Description |
|---|---|
| ServicesAPI | Points to the product web service of the Fusion Edge Server or Fusion Registry |
| Locales | Defines which Locales are supported on the User Interface. This generates a language picker in the main menu. Metadata from the backend service will be requested in the selected Locale. If there is a corresponding browser_lang_[locale].json file in the dist/properties it will be used to decode labels in the user interface. |
| DatasetNavigation | Defines which (if any) Concepts to allow a user to find data by (built into the sidebar) |
| DatasetByAgency | If true this will display a breakdown of Datasets by Agency |
| ShowAllDatasets | If true this will display a menu item which contains all Datasets in the system as child menu items |
Example:
{
 "ServicesAPI" : "https://demo11.metadatatechnology.com/FusionRegistry/ws/fusion/info/product",
 "Locales" : ["en", "he"],
 "ShowAllDatasets" : true,
 "DatasetByAgency" : false,
 "DatasetNavigation": [
   {
     "Components": ["REF_AREA"]
   },
   {
     "Components": ["CURRENCY"]
   },
   {
     "Title" : "Product By Area",
     "Components": ["REF_AREA", "TRD_PRODUCT"]
   }
 ]
}
Services API
"ServicesAPI" : "https://demo.metadatatechnology.com/FusionRegistry/ws/fusion/info/product"
The Services API property is the web service URL of the Fusion Registry or Fusion Edge Server's product information service. It will match the example above, this web service needs to be accessible for the Data Browser to work. The response from the Fusion Registry is the location of all the web service entry points required by the Fusion Data Browser to operate.
Locales
"Locales" : ["en", "he"]
The Locales property is an array of supported locales for the Fusion Data Browser. Adding a new Locale into this list will result in the Fusion Data Browser adding it to the drop down selection for the user to choose. When a user switches to the Locale all the metadata and data requested from the Registry or Edge server will be requested in the given locale. If the server is able to provide the information in this locale (i.e if the metadata has a label in the language) it will, otherwise it will revert to another language, defaulting to English.
The second purpose for the locale is to change all the labels and text in the Fusion Data Browser. This is achieved by the Fusion Data Browser loading a properties file called browser_lang_[lang].json. where [lang] is replaced with the 2 character language code selected by the user. This file is located under the properties folder. If there is no file for your locale, the the Fusion Data Browser will check all other locales in your array, in order, until it finds a file it can use to resolve all the browser labels. In the above example the "en" locale will be checked first, as it is the first locale in the array. If you wish to create labels in your locale, please copy one of the existing browser_lang files, and change the text in the file. If you wish to re-share your file with us, please get in touch.
"DatasetNavigation": [
   {
     "Components": ["COUNTRY"]
   },
   {
     "Components": ["CURRENCY"]
   },
   {
     "Title" : "Product Breakdown",
     "Components": ["TRD_PRODUCT"]
   }
 ]
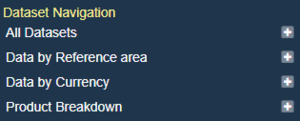
The DatasetNavigation property is used to control what breakdowns are presented in the sidebar. It is an array of Objects, where each Object represents a different breakdown.
The Components array lists the Dimenions to display a breakdown for. The Dimension ID is used, however it is not specific to any Data Structure Definition, so if multiple DSDs use the same ID for a Dimension, then they will all be included in the breakdown. Each breakdown has a genearted title of 'Data by [breakdown], however this title can be changed by adding a Title property. The above configuration will generate the following Navigation in the sidebar:
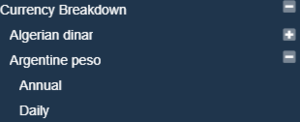
If more then one Dimension ID is placed in the Array, then the breakdown becomes hierarchical.
"Components": ["CURRENCY", "FREQ"]
The above will list the available Currencies in the Sidebar, and on Currency selection, the available Frequencies for the Currency will be shown.
Series Configuration
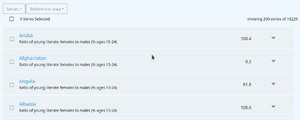
The seriesconfig.json file is used to configure how the Series List is displayed, and contains the following properties:
| Property | Description |
|---|---|
| MVIndicator | Each Series item can display the last Observation value as a headline figure. If the last Observation has no measure value, the MVIndicator value will be used in its place |
| ShowLastPeriod | If Show last Period is true, it will display the date of this last Observation next to the Observation value |
| ShowPCH | If true the Percentage change figure is presented next to the last Observation value. The percentage change is calculated based on the last 2 observation values for the Series |
| SparkColour | Defines the colour of the line in the Time series chart which is displayed when the Series is expanded |
| SparkStrokeThickness | Defines the thickness of the line in the Time series chart which is displayed when the Series is expanded |
Example:
{
 "MVIndicator" : "--",
 "ShowLastPeriod": true,
 "ShowPCH" : true,
 "SparkColour": "#60a76d",
 "SparkStrokeThickness": 1,
}
Chart Configuration
The chartconfig.json file is used to configure how the Time Series chart is displayed, and contains the following properties
| Property | Description |
|---|---|
| GroupCount | Defines the number of data points plotted for long time series |
| SeriesLimit | Restricts the time series chart to a maximum number of series plotted |
| SeriesDisplay | Defines the default display for Time Series labels |
| DateFormat | Defines the label presentation for different frequencies of data |
Group Count
"GroupCount" : 500,
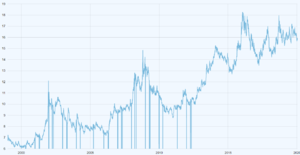
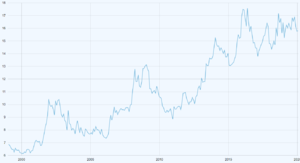
The Group count is used to prevent the time series chart from plotting every single data point on long time series. This can cause the chart to look messy, and contain far too much information for a user to meaningfully use.
The Group Count value indicates the maximum number of points to plot on a time series for the displayed range. When the user zooms into the chart, the time series will be refined to show more points.
It is possible to remove the Group Count by setting it to -1.
Series Limit
"SeriesLimit" : 20,
The Series Limit prevents a user from creating a Time Series chart with too many series. The limit can be unset by setting the value to -1, howver a time series chart with thousands of series will cause a web browser to become unresponsive as it tries to render the information, so a limit is recommended.
Series Display
 "Default": "${REF_AREA}\n${SERIES} \n[bold]{sdmxdate}[/] \n[bold]{valueY}[/]",
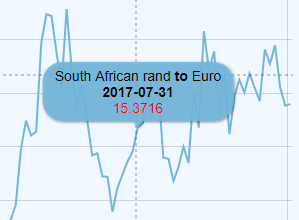
 "ECB:EXR(1.0)": "${CURRENCY} [bold]to[/] ${CURRENCY_DENOM} \n[bold]{sdmxdate}[/]\n[bold]{valueY}[/]",
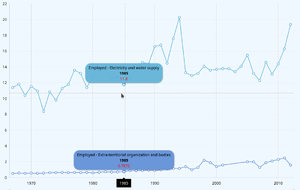
The Series Display property enables a Global configuration of the tooltips shown when a user hovers over a time series line.
Without this setting, the label defaults to showing the series key, in the format A:UK:EMP, where A is the reported value in the first Dimension, UK the reported value in the second Dimension and so on.
The Series Display properties are the URN short code of a Dataflow, for example "ECB:EXR(1.0)" refers to a European Central Bank dataset for EXR (Exchange Rates) at version 1.0. The Default property can be defined to apply a label rule to any dataset that does not have a specific rule.
The Syntax includes variable placeholders for Dimension or Attribute values, dates, and observation values. Markup can be used to change the font styling or text. The following table shows the syntax:
Text Variables
| Syntax | Description |
|---|---|
| ${REF_AREA} | Replaced by the value of the Reference Area Dimension, in the Locale set on the Data Browser (or an alternative Locale if there is not one avalable in the requested Locale) |
| {sdmxdate} | Replaced by the date in SDMX format, as reported in the dataset. For example 2001-Q1. |
| {valueY} | Replaced by the reported observation value |
Observation Value Modifiers
| Syntax | Description |
|---|---|
| {valueY.formatNumber('###.00')} | @see AM Charts Formatting Numbers |
| {valueY.open} | First (open) Observation value for the series, within current selection. |
| {valueY.high} | Highest observation value for the series, within current selection. |
| {valueY.low} | Lowest observation value for the series, within current selection. |
| {valueY.close} | Last (close) observation value for the series, within current selection. |
| {valueY.sum} | Sum of all values in a series, within current selection. |
| {valueY.count} | Number data items in series, within current selection. |
| {valueY.average} | Average values in a series, within current selection. |
| {valueY.change} | Difference between series first and last value |
| {valueY.changePercent} | Difference between series first and last values in percent. |
| {valueY.previousChange} | Difference between value of current and previous items. |
| {valueY.previousChangePercent} | Difference between value of current and previous items, in percent. |
Style
| Syntax | Description |
|---|---|
| \n | New Line |
| [bold]Text[/] | Outputs the 'Text' in Bold |
| [#00ff00]Green Text[/]! | Colours 'Green Text' green |
| [font-size: 30px]Large Text[/] | Uses inline CSS to make the font-size large |
