Difference between revisions of "Charts"
Jump to navigation
Jump to search
(→Overview) |
(→Dynamic Labels) |
||
| Line 15: | Line 15: | ||
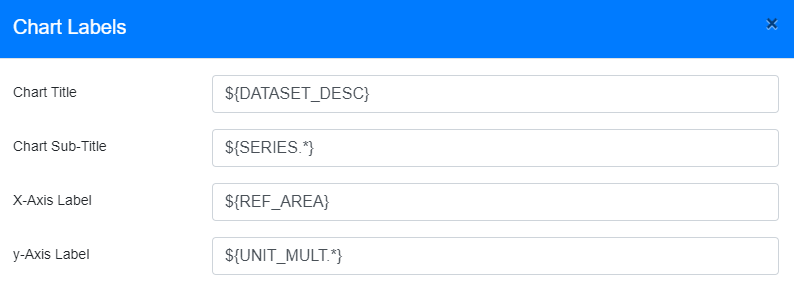
= Dynamic Labels = | = Dynamic Labels = | ||
| + | [[File:Databrowser chart labels.png|none]] | ||
= Time Series Chart = | = Time Series Chart = | ||
Revision as of 01:57, 5 April 2020
Contents
Overview
The Fusion Data Browser offers charting and tabulation capabilites to visulaise the series selected from the Series List page. There are three main categories of visualisations:
- Time Series Chart - Providing a view of series values over time
- Tabulation of Data - Providing a view of all series in a pivot table
- Cross Sectional Charts - Providing a view of a data sliced for a single time period and aggregated for one or more dimensions (example charts: Bar/Pie/Treemap/Pyramid)
Charts can be given dynamic lables which update as the data being charted changes, static lables, or a mixture of the two. Charts can also be saved locally, or shared as URL or embedded link.
General chart configuration is part of the Data Browser set up.
Dynamic Labels

Time Series Chart

The Time Series Chart provides a view of series over time.
Table

Bar Chart

Pie Chart

Pyramid Chart

