Difference between revisions of "Anatomy of the Data Browser"
(Created page with "= Overview = The Fusion Data Browser is simply a User Interface on top of Fusion Registry / Fusion Edge Server [https://en.wikipedia.org/wiki/Web_service web services]. When...") |
(→Dataset Navigation Menu) |
||
| Line 6: | Line 6: | ||
= Dataset Navigation Menu = | = Dataset Navigation Menu = | ||
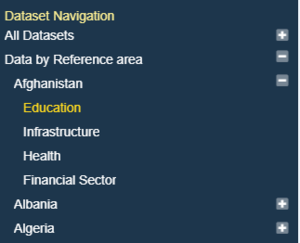
| + | The dataset navigation menu, shown on the left pane of the data browser, was arguably the most complex part of the data browser to build. In order to build the navbar, the client needs access to all the Dataflows, Data Structures, Concept and Codelists. The navigation menu is made doubly hard because the configuration allows for a hierarchy of Dimensions, for example the menu can display Reference Areas, followed by Indicators, followed by Datasets, each time the user expands part of the hierarchy, the data browser needs to make a call to the server to determine what child options are available based on the partial data query built so far. | ||
| + | In order to build the top level of the Dataset Navigation, the Data Browser makes a custom (non-sdmx) call based on the [https://github.com/sdmx-twg/sdmx-rest/wiki/Data-Availability SDMX Availability Query], but the key (and only) difference is, the Dataflow identifier is set to '''all'''. | ||
| + | |||
| + | https://demo.metadatatechnology.com/FusionRegistry/ws/public/sdmxapi/rest/availableconstraint/all/all?format=fusion-json&references=descendants&includeMetrics=dataflow&mode=available | ||
| + | |||
| + | The response to this query provides a Content Constraint for each Dataflow that has data, and as '''references=descendants''' all the associated Codelists, Concepts, and Data Structures are returned in the same response. | ||
| + | |||
| + | [[File:Databrowser datasets navbar.png|thumb]] | ||
= Free Text Search = | = Free Text Search = | ||
Revision as of 12:45, 5 April 2020
Contents
Overview
The Fusion Data Browser is simply a User Interface on top of Fusion Registry / Fusion Edge Server web services. When a user clicks on a link, it calls a web service and renders the response. It makes use of a great third party charting libaray, AmCharts to render the charts, all other code is built in house written in written in TypeScript) which transpiles into JavaScript.
This page takes your through the process and web service calls which are used to build the Fusion Data Browser, if you want to build your own Data Browser you can use the knowledge of what is possible to help.
The dataset navigation menu, shown on the left pane of the data browser, was arguably the most complex part of the data browser to build. In order to build the navbar, the client needs access to all the Dataflows, Data Structures, Concept and Codelists. The navigation menu is made doubly hard because the configuration allows for a hierarchy of Dimensions, for example the menu can display Reference Areas, followed by Indicators, followed by Datasets, each time the user expands part of the hierarchy, the data browser needs to make a call to the server to determine what child options are available based on the partial data query built so far.
In order to build the top level of the Dataset Navigation, the Data Browser makes a custom (non-sdmx) call based on the SDMX Availability Query, but the key (and only) difference is, the Dataflow identifier is set to all.
The response to this query provides a Content Constraint for each Dataflow that has data, and as references=descendants all the associated Codelists, Concepts, and Data Structures are returned in the same response.
