A beginners guide to Fusion Data Browser
Before using this Guide, please ensure that Fusion Data Bowater has been installed, configured and that all the steps in this article have been considered.
Contents
Overview
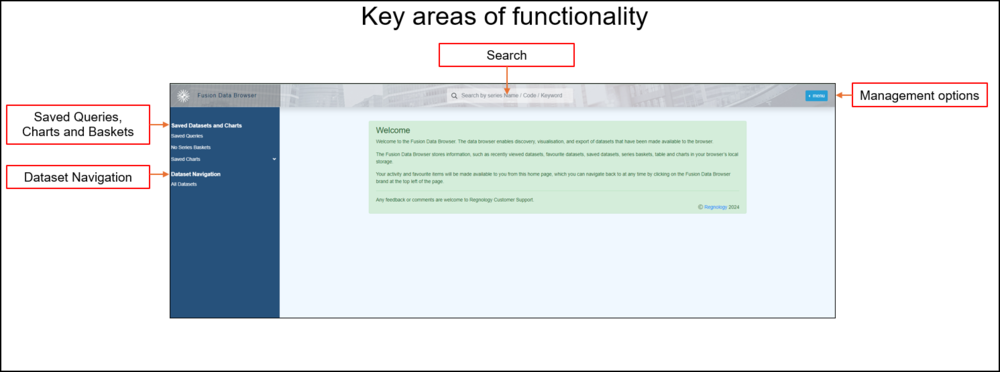
Fusion Data Browser is a web tool for data consumers to explore the Fusion Registry data catalogue, create charts and tables, and download data.
There are 4 key areas of functionality to consider:
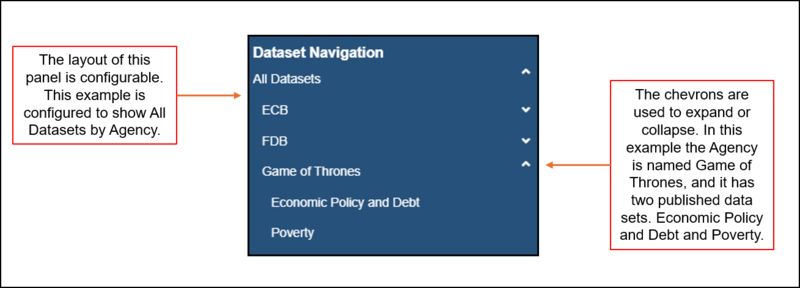
- Dataset Navigation
- Saved Queries, Charts and Baskets
- Search
- Management options
However, before any of the other functions can be used, you must start with data.
The image above shows the Fusion Data Browser is its initial state. There has been no activity so far. In order to start using the Browser, you must have data which has been published or registered.
Series List
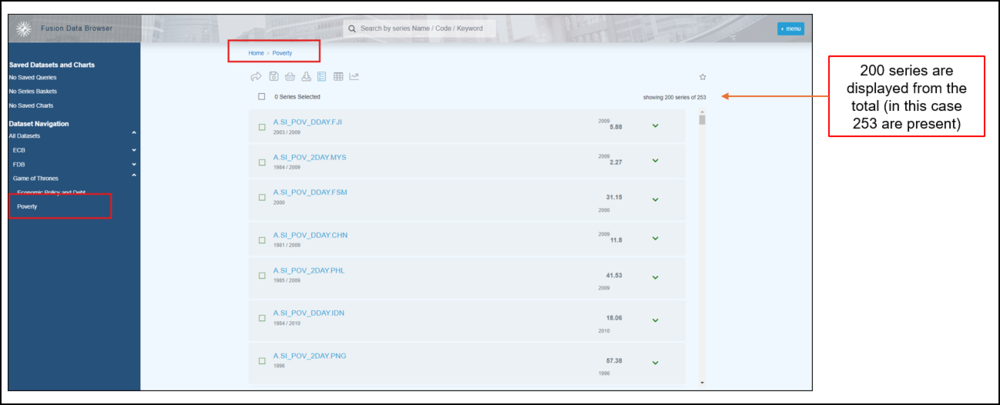
In the example below you can see that Poverty has been selected from the Navigation panel and in the mid section you will see a list of series.
Functions available
| Function | Display | Effect |
|---|---|---|
| Home | This will return you to the Home page. | |
| Dataset Name | Return to the Series List. | |
| Share | Creates a URL of the Page or the Query. This URL can be opened directly or copied to the clipboard. You can use this feature to send the URL which can be opened by anyone with that URL. The source Registry must be running for an ‘outsider’ to view the query. You can learn more about Sharing URLs Share URL in this article. | |
| Save | This enables you to save a Query. You can learn more about Saving Queries Data Browser Configuration in this article. | |
| Series Basket |  |
This enables you to save a selection of series to a new or existing basket. You can learn more about Series Baskets in this article. |
| Export Data |  |
This enables you to Export the data. You can learn more about the Export options in this article. |
| Series List |  |
This button is only active if you have moved to the Table or Time series display. If you are using one of these, clicking the Series List button will return you to the list as displayed above. You can learn more about the Export options in this article. |
| Table |  |
This button is active from the Series List and opens up the Data Browser Table which is explained further in this article. |
| Time Series | This button is active from Series List and opens up the Data Browser Time Series Chart which is explained further in this article. |
Data Browser Table
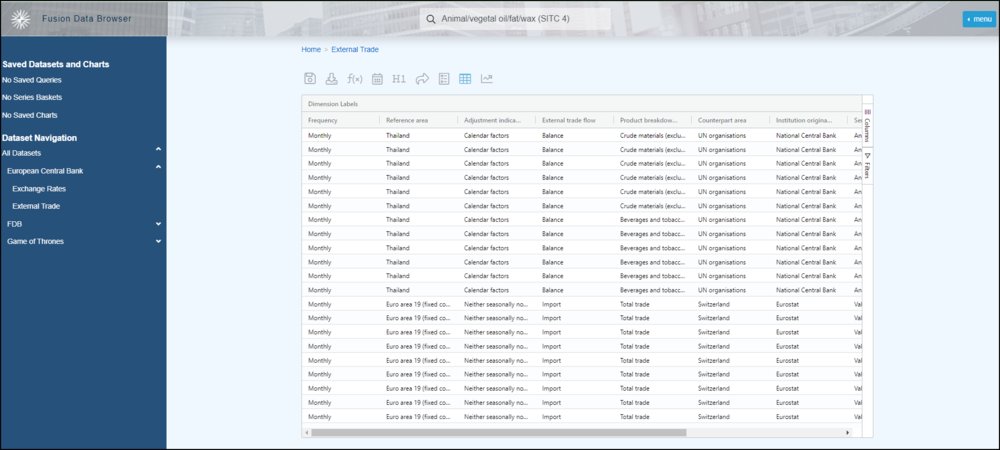
Clicking the  button will open up the Table View as shown in the example below.
Functions available here
| Function | Display | Effect |
|---|---|---|
| Save | This enables you to save a Chart. You can learn more about Saving Charts Data Browser Configuration in this article. | |
| Export Data |  |
This enables you to Export the data. You can learn more about the Export options in this article. |
| Calculations | This button enables you to perform Calculations, the Table view will be updated accordingly. You can learn more about Calculations Data Browser Table Calculations in this article | |
| Dataset Period | [[File:FDB Dataset Period.png|50px] | This button allows you to define a start and end period and or specify the (last) number of observations to be displayed in the Data Table. |
| H1 | This button allows you to create a title, and a sub-title for a chart which will appear on the Table view. You can enter free text or use the lookup feature to obtain a title from components in the Data Structure. | |
| Share | Creates a URL of the Page or the Query. This URL can be opened directly or copied to the clipboard. You can use this feature to send the URL which can be opened by anyone with that URL. The source Registry must be running for an ‘outsider’ to view the query. You can learn more about Sharing URLs Share URL in this article. | |
| Series List |  |
This button is only active if you have moved to the Table or Time series display. If you are using one of these, clicking the Series List button will return you to the list as displayed above. You can learn more about the Export options in this article. |
| Table |  |
This button is active from the Series List and opens up the Data Browser Table which is explained further in this article. |
| Time Series | This button is active from the Table and opens up the Data Browser Time Series Chart which is explained further in this article. |
Saved Queries, Charts and Baskets
Coming soon.
Management options
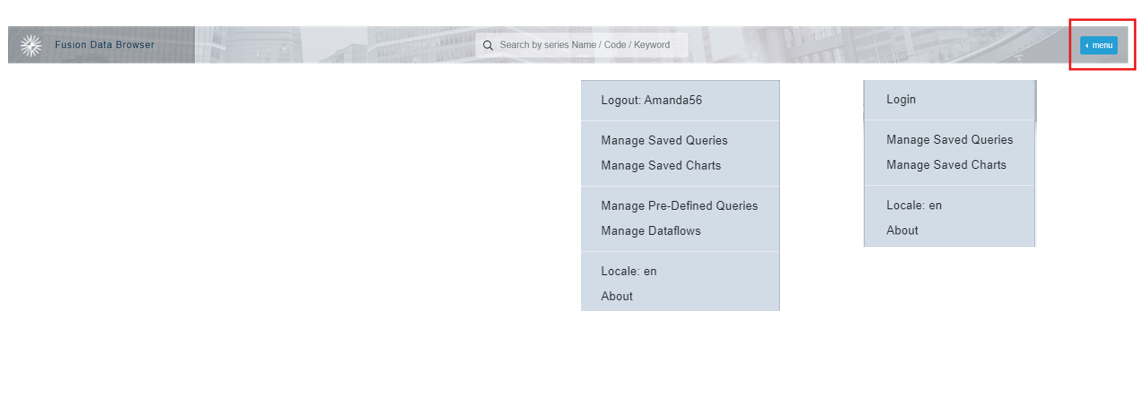
These are available from the Blue menu button as shown below.
Login / Logout
This menu allows you to Login and Out however please note that if you are already logged into Fusion Registry when you open the Data Browser, you will be logged in automatically.
The Management Options Managing Saved Charts and Queries is a user related function as explained in this article and there is no need to Login.
To use the options Manage Pre-Defined Queries and Managed Dataflows, you must be logged in as these are system wide features.
Locale:en
This option allows you to use any of the languages configured in the property files - you need to have the appropriate language identified in the siteconfig.json, for example:
"Locales" : ["en", "he", "ru"],
And a corresponding language property file must exist: for example: Browser_lang_he.json
You can learn more about languages in this article.
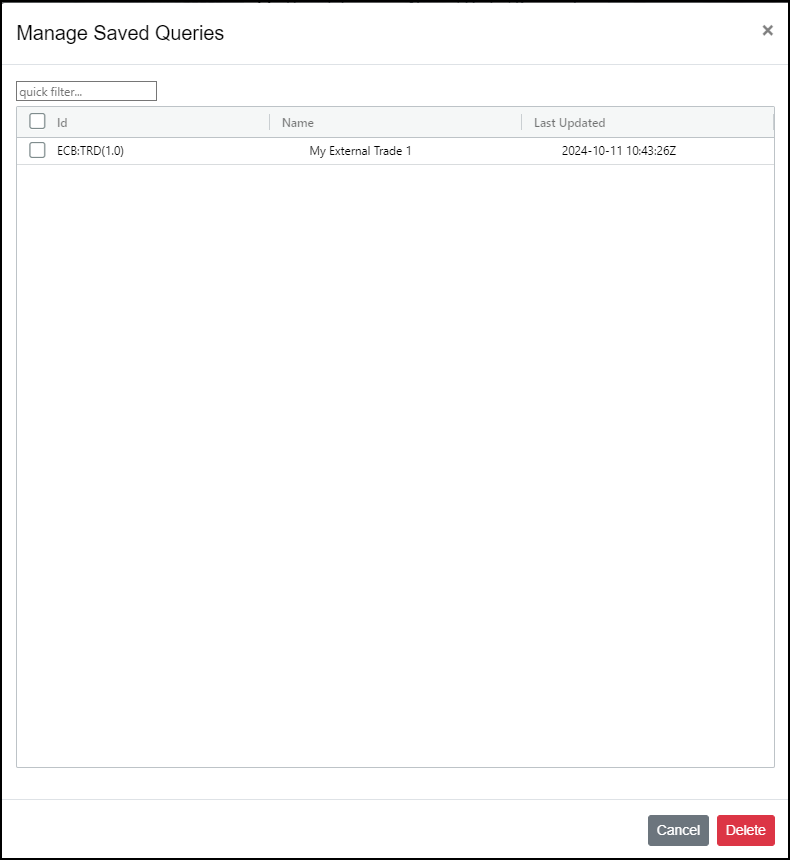
Saved Queries
When a query is saved, there is an option to save the query as Private (saved local) (this relates to User as described here or Public.
This option allows you to manage (Delete) Local (Private) queries.
To Manage Public Queries, you need to be logged in AND select the option Management option Pre-Defined Queries.
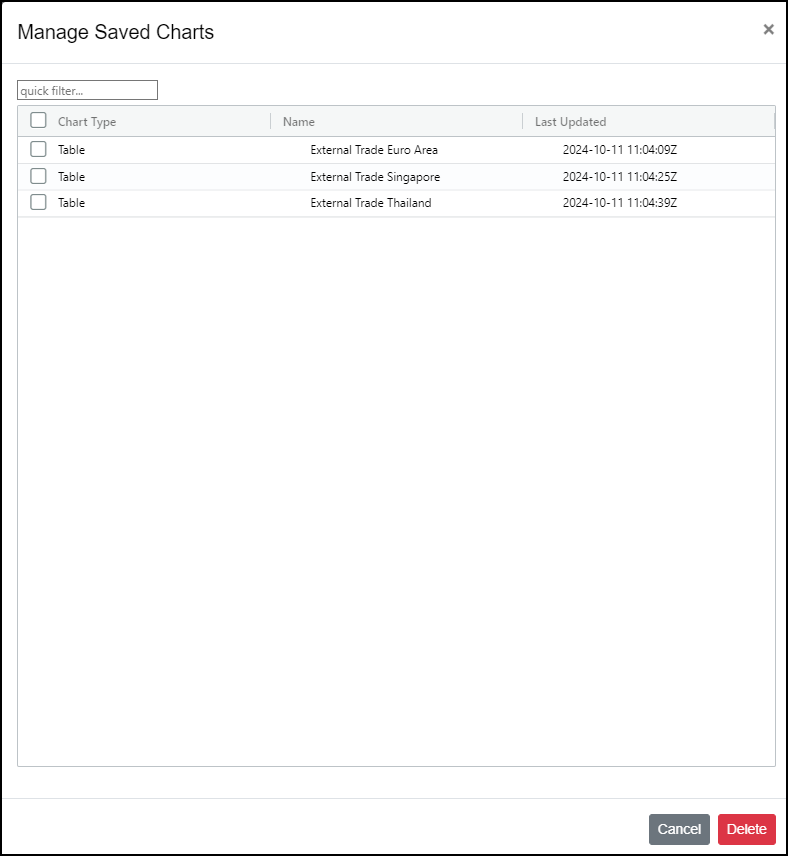
Saved Charts
Charts are saved as Private, i.e., locally to the user as described in this article.
This option allows you to manage (Delete) Local Charts.
Pre-Defined Queries
This option is only available to a logged on user. You can read more about Pre-Defined Queries in this article.
Options available:
Delete
Use this option to delete the query for all users.
Run Query
Use this option to run the query, it will open up the Series List (for that query).
Linked Categories
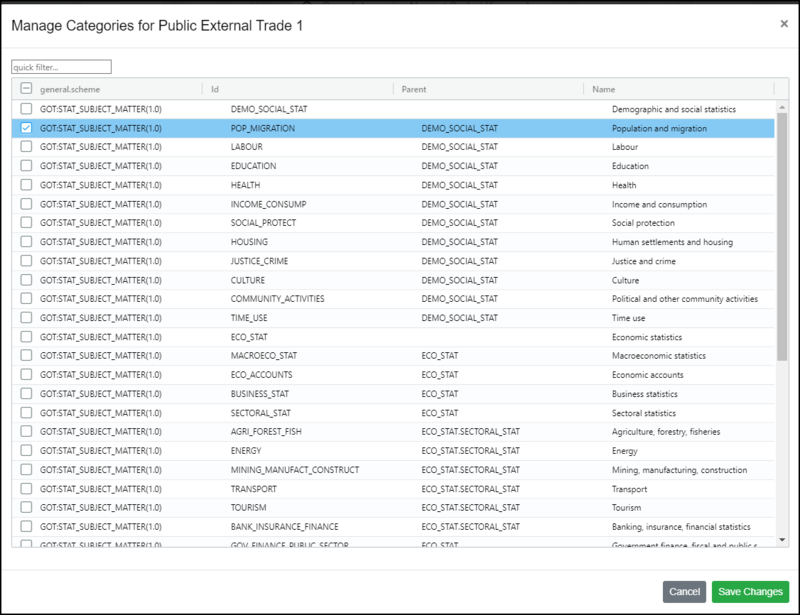
Pe-Defined Categories can appear on the dataset list as shown in the example below.
The Manage option Linked categories enables you to do this. First, select the Pre-Defined Query then click Linked Categories to display a list of all categories within any categorisation scheme available.
Select the Categorisation(s) to use then Save the changes. The Pre-Defined Query will appear on the Datasets list.
Note, the Categories are also available to view, add or delete via Fusion the Registry Categorisations option. You can read more in this article.
Manage Dataflows
The Manage Dataflows option enables you to specify how the Dataset is to appear in the Dataset list (in the same manner as the Pre-Defined Queries described above) and in the series list.
Series List
When you select Manage Dataflows a list of all Dataflows will appear, you can use the quick filter to find the one you want to manage.
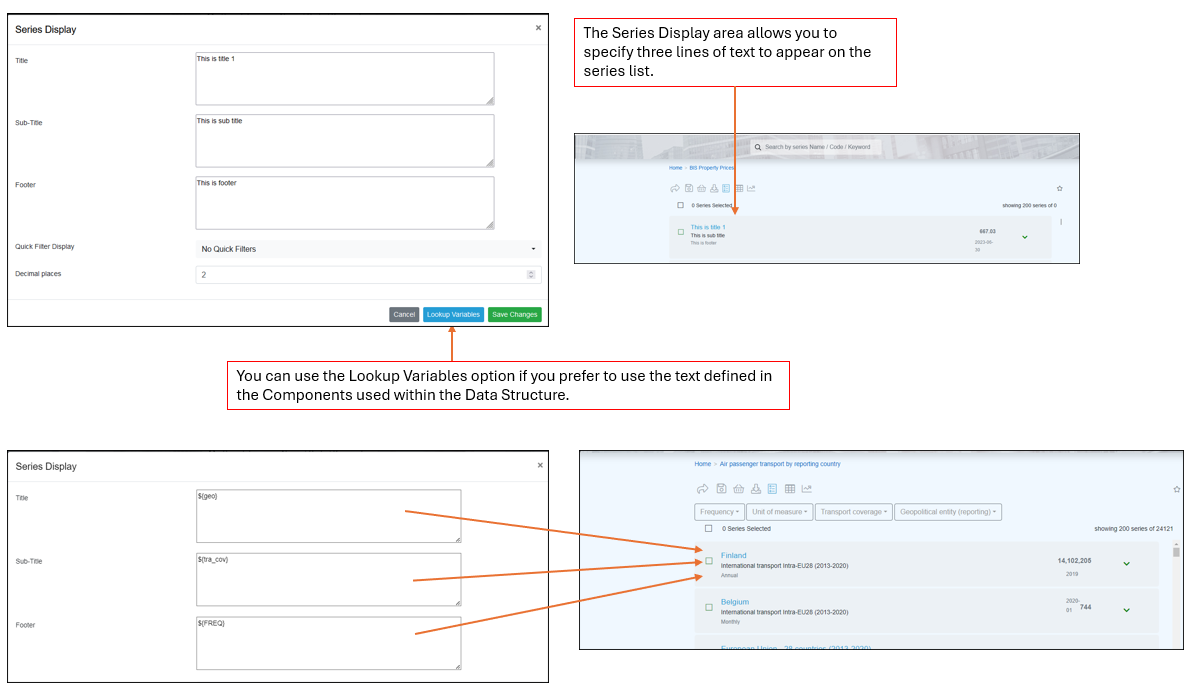
Series Display
Textural options
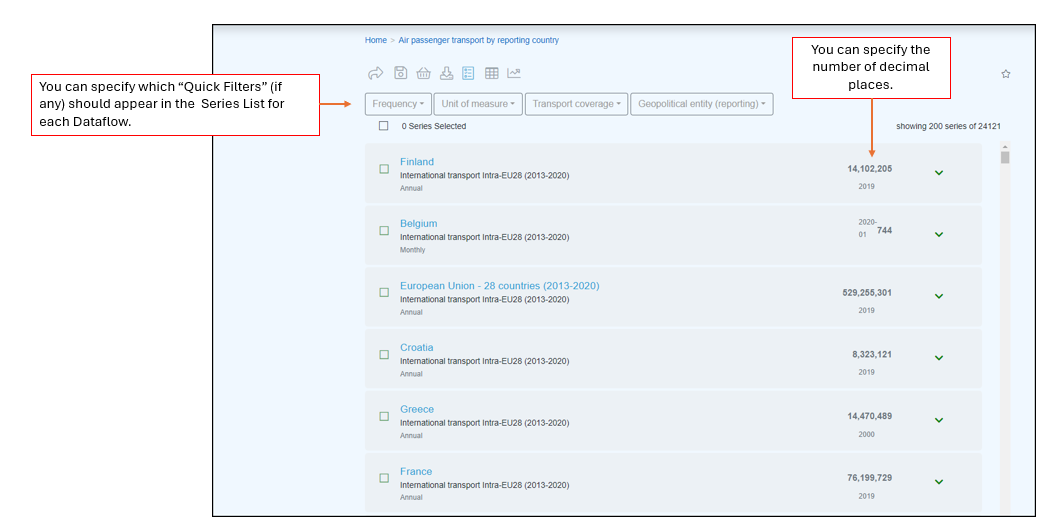
Quick Filters Display
Three options are available:
None No filters will be displayed on the Series List but you can use all the filters available to a specific Dataset via the Table view.
Include all Dimensions Every available option will be included. Note that attributes can only be used as filters via the Table view.
Pick Specific Dimension If you select this option, a list of available Dimensions will be displayed, you can select as shown below.
Decimal Places
There is no default so if you make any changes to this feature, you must specify a number of decimal places.
When done, click Save. To see the changes, reload the Dataset.
Linked Categories
Linked Categories can appear on the dataset list as shown in the example below.
The Manage Dataflow option Linked categories enables you to do this. First, select the Dataflow then click Linked Categories to display a list of all categories within any categorisation scheme available.
Select the Categorisation(s) to use then Save the changes. The Category will appear on the Datasets list.
Note, the Categories are also available to view, add or delete via Fusion the Registry Categorisations option. You can read more in this article.
Useful Articles
Data Browser Time Series Chart
Calculations in the Data Table
