Difference between revisions of "Data Browser Export"
(→Example) |
(→Example) |
||
| Line 97: | Line 97: | ||
[[File:FDB-Export-Excel-Time-Series-example.png|800px]] | [[File:FDB-Export-Excel-Time-Series-example.png|800px]] | ||
| + | |||
| + | |||
| + | |||
| + | ==Excel Table== | ||
| + | ===Options=== | ||
| + | |||
| + | |||
| + | [[File:FDB-Export-Excel-Tables.png|600px]] | ||
| + | |||
| + | |||
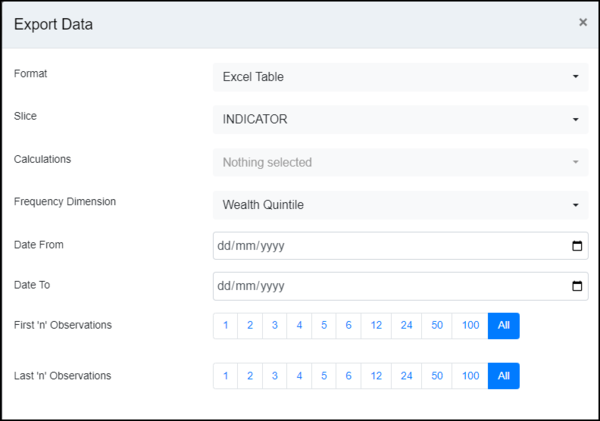
| + | Note that in this example, the Data Structure does not include a Frequency Dimension. Fusion Data Browser will select an option, to change the option select one from the dropdown list. | ||
| + | |||
| + | This option allows you to select a Dimension for ‘Slicing’ purposes in which case a worksheet will be output per slice value, e.g slice by FREQ would output Annual Data in one worksheet, Monthly data in another, and so on. | ||
| + | |||
| + | |||
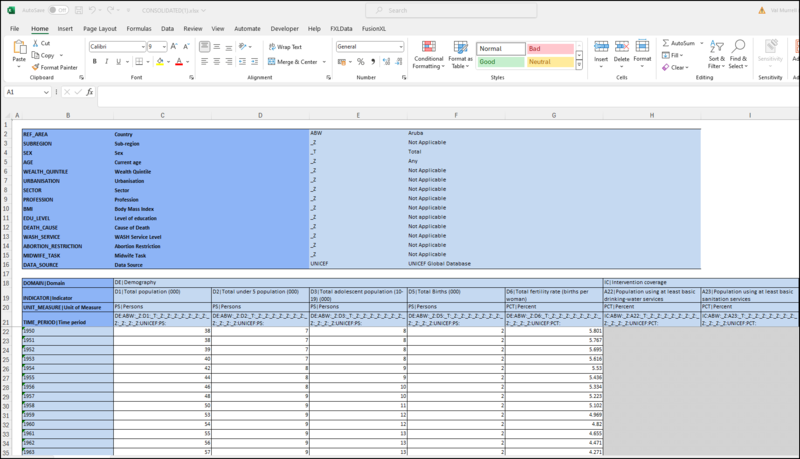
| + | [[File:FDB-Export-Excel-Table-example.png|800px]] | ||
| + | |||
| + | |||
| + | ==Refreshable Excel== | ||
| + | ===Options=== | ||
| + | |||
| + | |||
| + | [[File:FDB-Export-Refreshable Excel.png|600px]] | ||
| + | |||
| + | |||
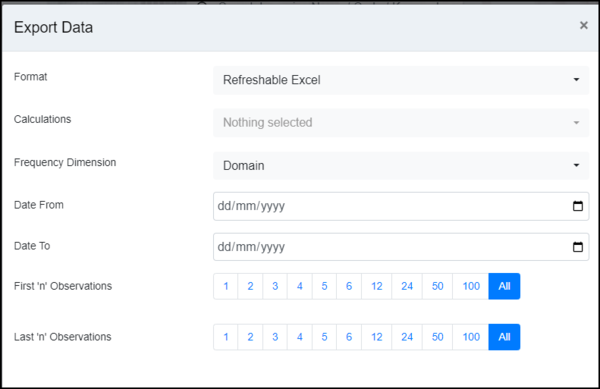
| + | Note that in this example, the Data Structure does not include a Frequency Dimension. Fusion Data Browser will select an option, to change the option select one from the dropdown list. | ||
| + | |||
| + | This option creates a worksheet which will contain the query URL in Cell B1 and the FXLData query =FXLDataUrl in cell B2 together with the function which applies the function to the query URL. However for this to function you do need to have the Addin for FXLData installed. You can learn more about [[FXLData|in this article]]. | ||
| + | |||
| + | |||
| + | ===Example=== | ||
| + | In this example the query URL is https://demo11.metadatatechnology.com/FusionRegistry/sdmx/v2/data/dataflow/CD2030/CONSOLIDATED/1.0?c%5BREF_AREA%5D=ABW&data=&freqDim=DOMAIN&labels=both&locale=en&saveAs=CONSOLIDATED and produces this result. | ||
| + | |||
| + | |||
| + | [[File:FDB-Export-Refreshable-example.png|800px]] | ||
Revision as of 05:20, 21 October 2024
Contents
Overview
The Export facility is available in the Series List, the Table Chart and the Time Series chart.
Several Formats are available depending on the settings in the exportconfig.json file which defines which formats will be available and what parameters will be offered.
The options available also differ depending on the type of format selected and the structure of the Dataset selected.
You can read more about Export Configuration in this article.
Formats available:
- CSV
- SDMX
- Excel Series
- Excel Time Series
- Excel Table
- Refreshable Excel
Every format allows you to specify a period and observation number as described in this article.
Every format allows you to apply Calculations to the Export, you can read more about in this article.
Every format allows you to save the file or view the resulting query URL.
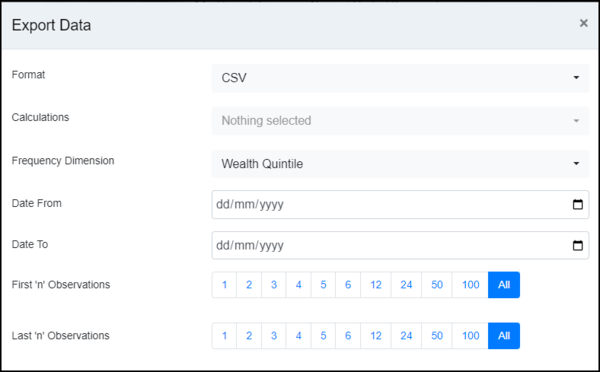
CSV
Options
Note that in this example, the Data Structure does not include a Frequency Dimension. Fusion Data Browser will select an option, to change the option select one from the dropdown list.
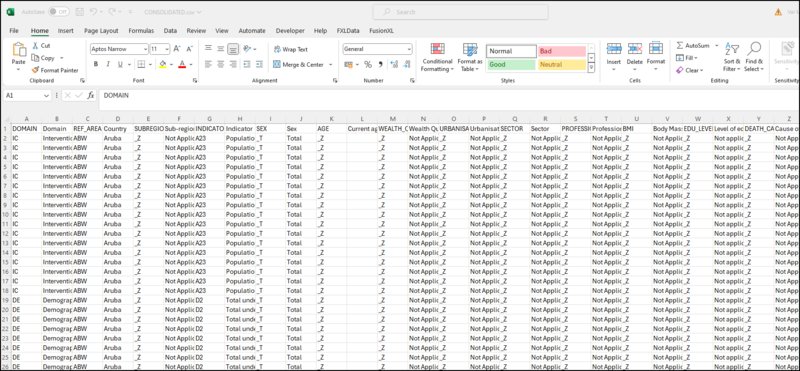
Example
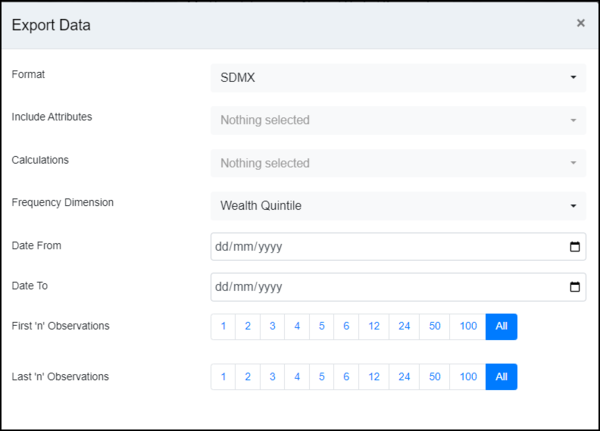
SDMX
Options
When you select type SDMX, you can include Attributes. Click on the dropdown and select which are to be included.
Note that in this example, the Data Structure does not include a Frequency Dimension. Fusion Data Browser will select an option, to change the option select one from the dropdown list.
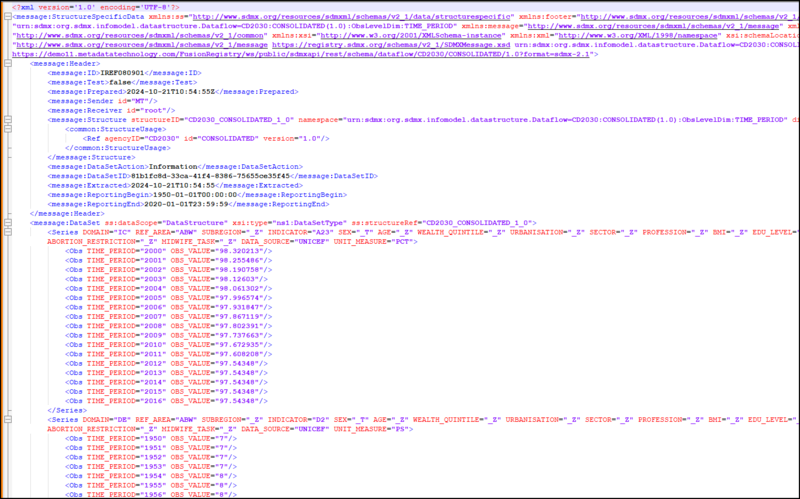
Example
Excel Series
Options
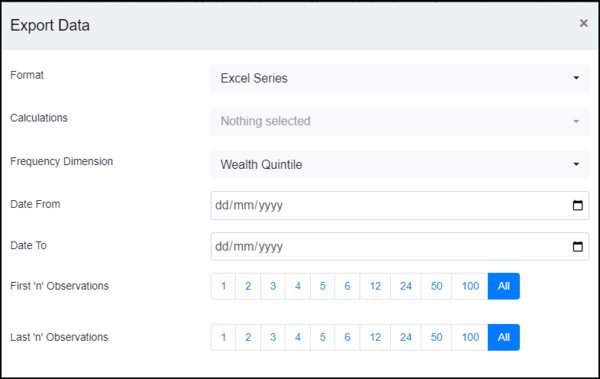
Note that in this example, the Data Structure does not include a Frequency Dimension. Fusion Data Browser will select an option, to change the option select one from the dropdown list.
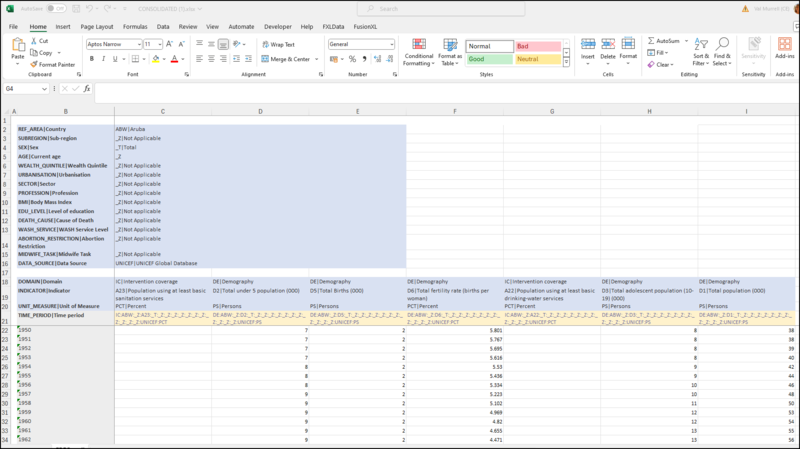
Example
Excel Time Series
Options
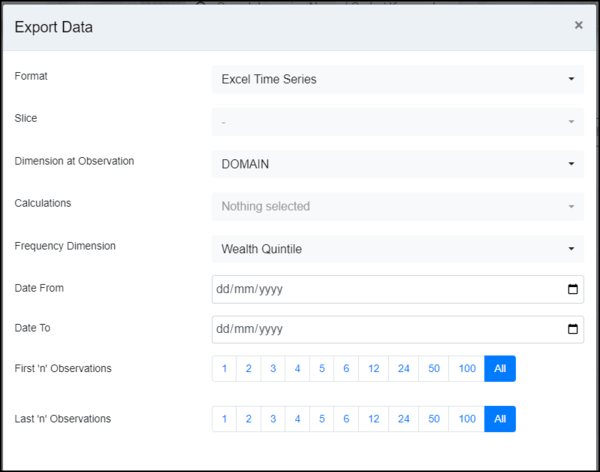
Note that in this example, the Data Structure does not include a Frequency Dimension. Fusion Data Browser will select an option, to change the option select one from the dropdown list.
This option allows you to select a Dimension for ‘Slicing’ purposes in which case a worksheet will be output per slice value, e.g slice by FREQ would output Annual Data in one worksheet, Monthly data in another, and so on.
Dimension at Observation - to do.
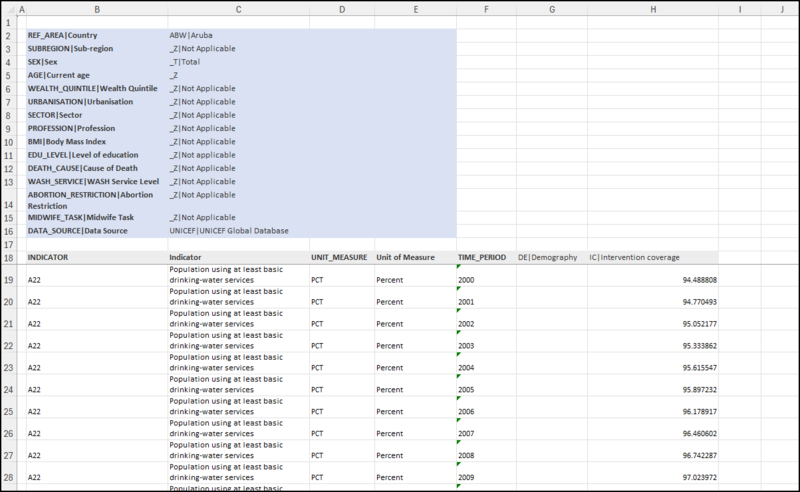
Example
Excel Table
Options
Note that in this example, the Data Structure does not include a Frequency Dimension. Fusion Data Browser will select an option, to change the option select one from the dropdown list.
This option allows you to select a Dimension for ‘Slicing’ purposes in which case a worksheet will be output per slice value, e.g slice by FREQ would output Annual Data in one worksheet, Monthly data in another, and so on.
Refreshable Excel
Options
Note that in this example, the Data Structure does not include a Frequency Dimension. Fusion Data Browser will select an option, to change the option select one from the dropdown list.
This option creates a worksheet which will contain the query URL in Cell B1 and the FXLData query =FXLDataUrl in cell B2 together with the function which applies the function to the query URL. However for this to function you do need to have the Addin for FXLData installed. You can learn more about in this article.
Example
In this example the query URL is https://demo11.metadatatechnology.com/FusionRegistry/sdmx/v2/data/dataflow/CD2030/CONSOLIDATED/1.0?c%5BREF_AREA%5D=ABW&data=&freqDim=DOMAIN&labels=both&locale=en&saveAs=CONSOLIDATED and produces this result.
