Difference between revisions of "Chart Labels"
Jump to navigation
Jump to search
(→Time Series Charts) |
(→Table Charts) |
||
| (5 intermediate revisions by the same user not shown) | |||
| Line 1: | Line 1: | ||
| − | This allows you to define headings (Titles) for your charts . You can either use a Variable or enter free format text | + | [[Category:Fusion Data Browser]] |
| − | + | This feature allows you to define headings (Titles) for your charts. You can either use a Variable or enter free format text. | |
| − | |||
| + | Using the Variable option opens up a list from which you can copy a label to the clipboard and then paste it into the heading label. | ||
==Table Charts== | ==Table Charts== | ||
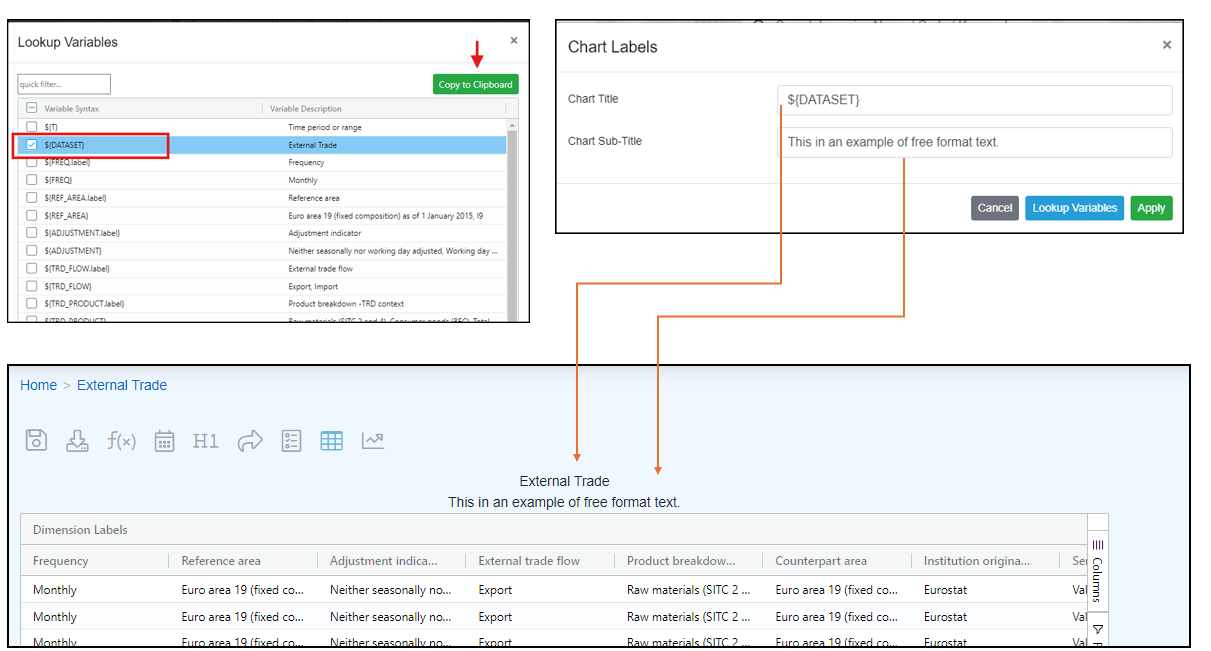
| − | The example below shows a Table Chart | + | The example below shows a Table Chart that has a Variable as the Title and free format text as the Sub-Title. |
[[File:FDB-Table-Chart-Labels.png]] | [[File:FDB-Table-Chart-Labels.png]] | ||
| − | |||
==Time Series Charts== | ==Time Series Charts== | ||
[[File:FDB-Series-Chart-Labels.png|1200px]] | [[File:FDB-Series-Chart-Labels.png|1200px]] | ||
| − | |||
| − | |||
Latest revision as of 02:16, 30 October 2024
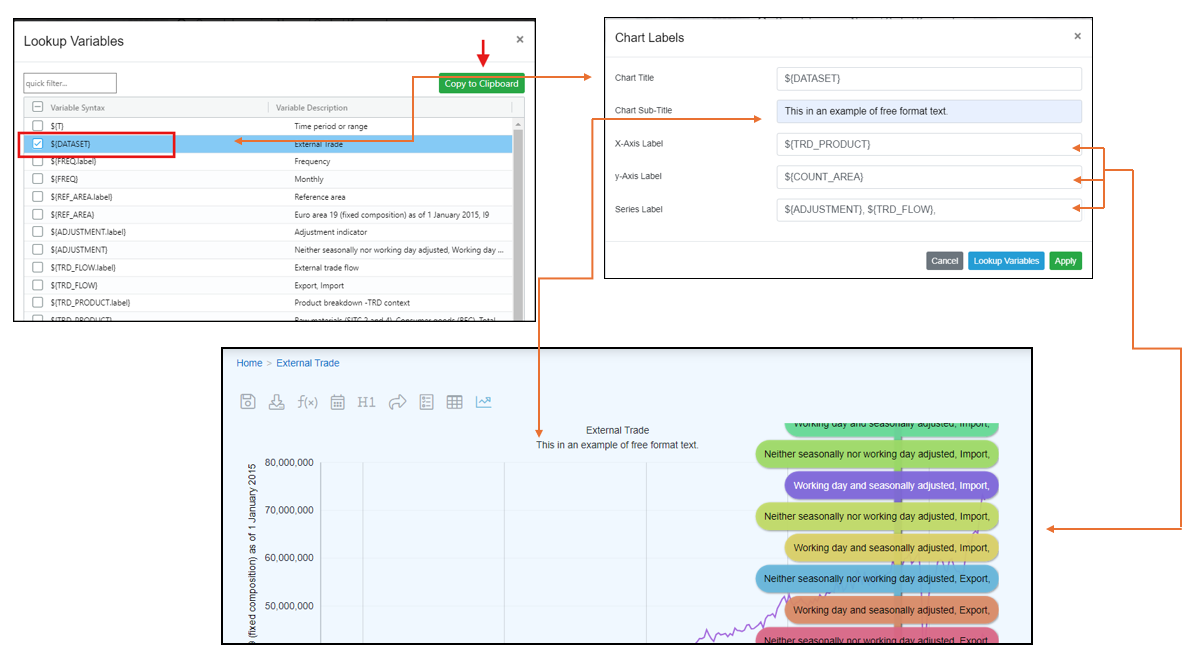
This feature allows you to define headings (Titles) for your charts. You can either use a Variable or enter free format text.
Using the Variable option opens up a list from which you can copy a label to the clipboard and then paste it into the heading label.
Table Charts
The example below shows a Table Chart that has a Variable as the Title and free format text as the Sub-Title.

