Difference between revisions of "Tableau Connector"
(→Filter Data) |
|||
| (4 intermediate revisions by the same user not shown) | |||
| Line 1: | Line 1: | ||
| − | |||
[[Category:How_To]] | [[Category:How_To]] | ||
=Overview= | =Overview= | ||
| Line 32: | Line 31: | ||
== Choose Dataset(s) == | == Choose Dataset(s) == | ||
| − | [[File:Tableau-wdc-step3.png| | + | [[File:Tableau-wdc-step3.png|700px]] |
The available Datasets from the Fusion Registry are displayed in Tableau’s embedded web browser, the user is able to choose one or more Datasets to query. After selecting one or more datasets, click Next. | The available Datasets from the Fusion Registry are displayed in Tableau’s embedded web browser, the user is able to choose one or more Datasets to query. After selecting one or more datasets, click Next. | ||
== Filter Data == | == Filter Data == | ||
| − | [[File:Tableau Filter Data.png| | + | [[File:Tableau Filter Data.png|700px]] |
The next step shows all the available dimensions, and filters for each dimension, for the chosen datasets. If multiple datasets were selected in step 2, then the list of dimensions is the combination of dimensions from all datasets, with the values for each dimension being the combination of common dimensions. It should be noted that with multiple dataset selection it possible to construct a query which only retrieves data from a subset of selected datasets. | The next step shows all the available dimensions, and filters for each dimension, for the chosen datasets. If multiple datasets were selected in step 2, then the list of dimensions is the combination of dimensions from all datasets, with the values for each dimension being the combination of common dimensions. It should be noted that with multiple dataset selection it possible to construct a query which only retrieves data from a subset of selected datasets. | ||
== Get Data == | == Get Data == | ||
| − | [[File:Tableau | + | [[File:Tableau go to worksheet.png|700px]] |
On clicking ‘Get Data’ in the Web Data Connector, the embedded browser window will close, and the dataset tables resulting from the data query will be displayed in the left hand pane. Drag and drop the table into the drop zone shown in the above image, and then click the Update Now button to retrieve the data. If multiple tables are put into the drop zone, Tableau will provide mechanisms for performing table joins. | On clicking ‘Get Data’ in the Web Data Connector, the embedded browser window will close, and the dataset tables resulting from the data query will be displayed in the left hand pane. Drag and drop the table into the drop zone shown in the above image, and then click the Update Now button to retrieve the data. If multiple tables are put into the drop zone, Tableau will provide mechanisms for performing table joins. | ||
| Line 48: | Line 47: | ||
Once Tableau gets the data, it will be displayed in the table, as shown in the image above. Each coded SDMX Dimension and Attribute will show both the code id and code name, code names will be displayed according to the user’s locale settings if multilingual names were defined in the SDMX metadata. It is possible at this point to hide/show columns, or click on ‘Sheet 1’ to construct a data visualisation of the data. The visualisations can be saved, and the data in the visualisations can be updated directly from the Fusion Registry using the data refresh mechanisms provided by Tableau. | Once Tableau gets the data, it will be displayed in the table, as shown in the image above. Each coded SDMX Dimension and Attribute will show both the code id and code name, code names will be displayed according to the user’s locale settings if multilingual names were defined in the SDMX metadata. It is possible at this point to hide/show columns, or click on ‘Sheet 1’ to construct a data visualisation of the data. The visualisations can be saved, and the data in the visualisations can be updated directly from the Fusion Registry using the data refresh mechanisms provided by Tableau. | ||
| + | Example Visualisation | ||
| − | [[File:Tableau | + | [[File:Tableau example visualisation.png|700px]] |
| + | |||
| + | == Observation Value == | ||
| + | When testing the new Tableau connector, we found that pervious visualisations did not work as expected due to the data type as set in the Data Structure for the Observation Value. If this happens, you can either change the data type or follow these steps in Tableau. | ||
| + | |||
| + | # Right click the Obs Value and convert it to a Measure | ||
| + | # Having done that, right click again and select Change Data type, select Number and then Decimal | ||
| + | # Right click Obs Value again and select Default Properties and then Aggregation, select Sum | ||
Latest revision as of 03:38, 3 November 2025
Contents
Overview
It is possible to connect Tableau to the data web services of the Fusion Registry and Fusion Edge Server. The connection makes use of Tableau's Web Data Connector framework, which enables the Fusion software to integrate seamlessly as a datasource. Please note that Tableau's Web Data Connector 2.0 has been depreciated and may no longer work in previous versions of Fusion Registry.
Regnology Release R1.1.0.00 July 2024 now includes support for Tableau's Web Data Connector 3.0 and has been tested using Tableau Public Edition 2024.1.4.
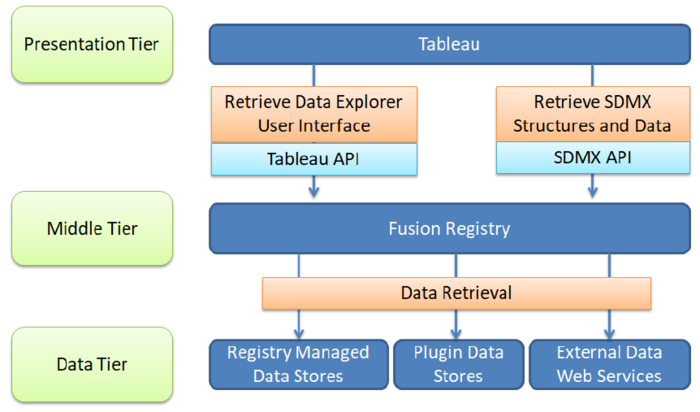
The following image shows the high level architecture, where Tableau is acting as the presentation tier, enabling users to view, tabulate, graph and analyse data. The Fusion Registry provides Tableau an API for data retrieval, where ultimately the data will live in one or more data stores, which may have varying types.
Connecting Tableau to the Fusion Registry
These steps work for both the commercial version of Tableau, as well as the free to use public version, both available from the Tableau website.
Connect to Registry / Edge Server Service
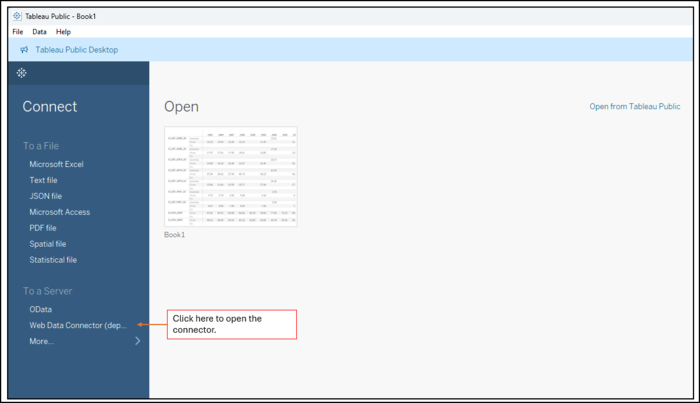
After opening Tableau connect to a Server, choosing the Web Data Connector. If this option is not shown in the left hand navigation bar, click ‘More…’ to show the option in the right hand window, as shown below.
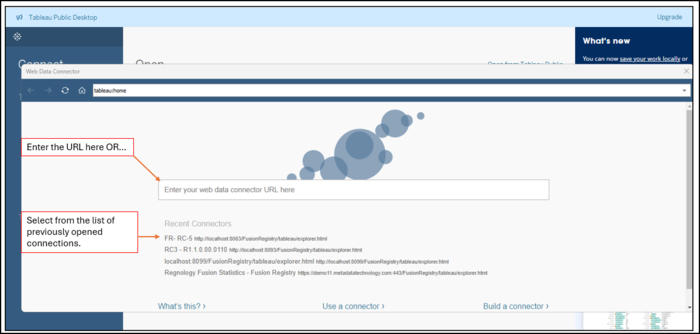
After clicking the Web Data Connector option, a pop up window will appear, this is the embedded web browser in Tableau. This invites the user to enter the URL to connect to. The URL for the Fusion Registry is: http(s)://[registry url]/tableau/explorer.html For example: https://demo.metadatatechnology.com/FusionRegistry/tableau/explorer.html
NOTE: The above URL is not designed to work in a web browser, whilst a page will display you will not be able to use it to get data unless it is accessed via the Tableau Web Data Connector.
On entering this URL, and pressing [enter] Tableau will retrieve the User Interface from the Fusion Registry and present it in the embedded browser, as shown below
Choose Dataset(s)
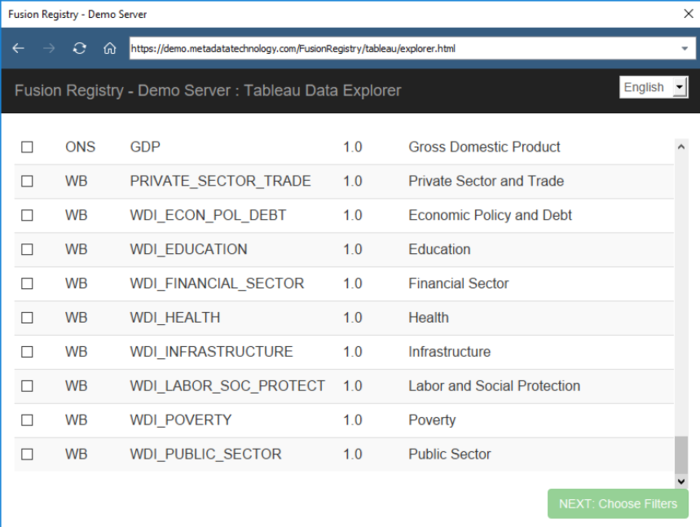
The available Datasets from the Fusion Registry are displayed in Tableau’s embedded web browser, the user is able to choose one or more Datasets to query. After selecting one or more datasets, click Next.
Filter Data
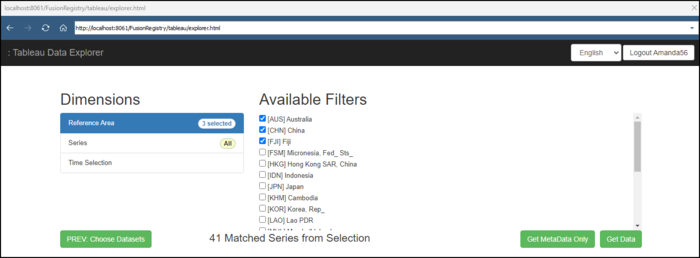
The next step shows all the available dimensions, and filters for each dimension, for the chosen datasets. If multiple datasets were selected in step 2, then the list of dimensions is the combination of dimensions from all datasets, with the values for each dimension being the combination of common dimensions. It should be noted that with multiple dataset selection it possible to construct a query which only retrieves data from a subset of selected datasets.
Get Data
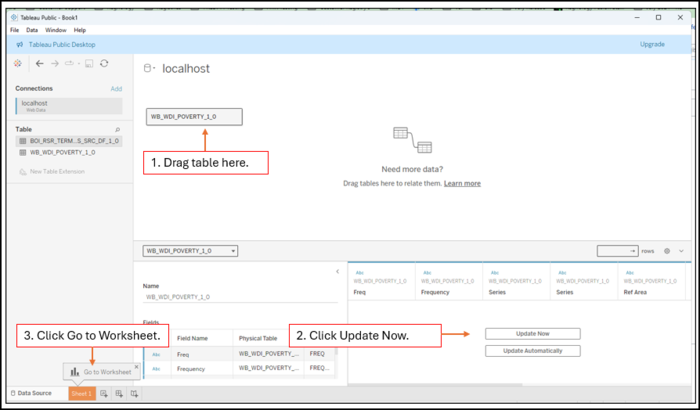
On clicking ‘Get Data’ in the Web Data Connector, the embedded browser window will close, and the dataset tables resulting from the data query will be displayed in the left hand pane. Drag and drop the table into the drop zone shown in the above image, and then click the Update Now button to retrieve the data. If multiple tables are put into the drop zone, Tableau will provide mechanisms for performing table joins.
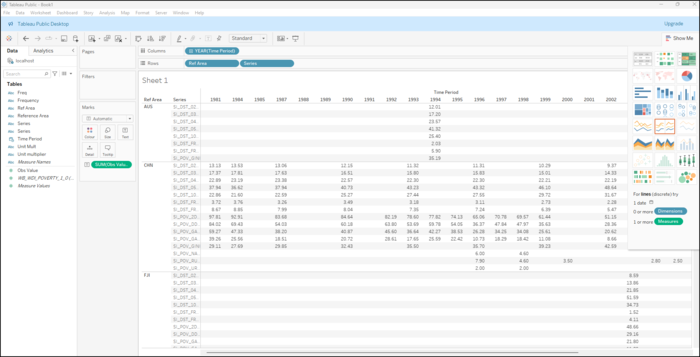
Once Tableau gets the data, it will be displayed in the table, as shown in the image above. Each coded SDMX Dimension and Attribute will show both the code id and code name, code names will be displayed according to the user’s locale settings if multilingual names were defined in the SDMX metadata. It is possible at this point to hide/show columns, or click on ‘Sheet 1’ to construct a data visualisation of the data. The visualisations can be saved, and the data in the visualisations can be updated directly from the Fusion Registry using the data refresh mechanisms provided by Tableau.
Example Visualisation
Observation Value
When testing the new Tableau connector, we found that pervious visualisations did not work as expected due to the data type as set in the Data Structure for the Observation Value. If this happens, you can either change the data type or follow these steps in Tableau.
- Right click the Obs Value and convert it to a Measure
- Having done that, right click again and select Change Data type, select Number and then Decimal
- Right click Obs Value again and select Default Properties and then Aggregation, select Sum
