Difference between revisions of "FusionXL DataAuthor"
(→Author Helper) |
(→Features Overview) |
||
| (16 intermediate revisions by the same user not shown) | |||
| Line 3: | Line 3: | ||
The image below shows the Connected Registry along with the name of the logged in user. | The image below shows the Connected Registry along with the name of the logged in user. | ||
| + | |||
| + | Note: This section has been updated to include enhanced functionality released in Version 2.5 of FusionXL. Older versions will not work exactly as described below. To obtain the latest Version of Fusion XL, it can be downloaded from the Meta Data Technology web site in the [https://metadatatechnology.com/community/ Community Tools area.] | ||
| Line 21: | Line 23: | ||
|- | |- | ||
| [[File:Convert Data Button.PNG|60px]] || Convert Data|| Allows users to convert the data into one of the supported formats. | | [[File:Convert Data Button.PNG|60px]] || Convert Data|| Allows users to convert the data into one of the supported formats. | ||
| − | |||
| − | |||
|} | |} | ||
| Line 47: | Line 47: | ||
* FUSION-JSON | * FUSION-JSON | ||
| − | An example of a | + | An example of a dataset (a subset of ECB:TRD taken from our demo site) is shown below. |
| Line 56: | Line 56: | ||
The way the labels are displayed differs depending on the type of component and whether it is 'coded' or not. Components in a Data Structure can be linked to a Codelist to ensure that only permitted data is entered. The permitted values and be see in the '''Author Helper''' which is discussed below. | The way the labels are displayed differs depending on the type of component and whether it is 'coded' or not. Components in a Data Structure can be linked to a Codelist to ensure that only permitted data is entered. The permitted values and be see in the '''Author Helper''' which is discussed below. | ||
| − | Three | + | Three colours are in use along with bold text: |
{| class="wikitable" | {| class="wikitable" | ||
| Line 62: | Line 62: | ||
! Colour !! Used for | ! Colour !! Used for | ||
|- | |- | ||
| − | | Black|| Coded | + | | Black|| Coded Attributes which are not mandatory. Time and Measure Components |
|- | |- | ||
| Black + Bold|| Coded Dimensions | | Black + Bold|| Coded Dimensions | ||
|- | |- | ||
| − | | Brown|| Uncoded | + | | Brown|| Uncoded Dimensions and Attributes) |
|- | |- | ||
| − | | Brown + Bold|| Mandatory Uncoded | + | | Brown + Bold|| Mandatory Uncoded Attributes and Uncoded Dimensions |
|- | |- | ||
| − | | Red + Bold|| Mandatory Coded | + | | Red + Bold|| Mandatory Coded Dimensions and Attributes |
|- | |- | ||
|} | |} | ||
| Line 80: | Line 80: | ||
This option allows a logged in user (with the appropriate permissions) to create a dataset for a Provision Agreement held in the connected Registry. | This option allows a logged in user (with the appropriate permissions) to create a dataset for a Provision Agreement held in the connected Registry. | ||
| − | Once this option is selected new window will open enabling you to | + | Once this option is selected new window will open enabling you to choose from the Provision Agreements held on the connected Registry as shown in the example below. |
[[File:Create a Data Set.PNG|600px]] | [[File:Create a Data Set.PNG|600px]] | ||
| Line 101: | Line 101: | ||
The red indicators show that more information is available using the Note or Comment Excel feature (depending on which version of MS Excel you are using) and will reveal more information regarding the component. | The red indicators show that more information is available using the Note or Comment Excel feature (depending on which version of MS Excel you are using) and will reveal more information regarding the component. | ||
| − | The dataset is built by reference to the Data Structure linked to the selected Dataflow for the chosen Data Provider. The Data Structure allows a user to define the components included in the FXL worksheet and specify whether they are coded (by reference to a codelist within the Registry). Components have types which again influences the worksheet. Types can be Dimensions, Attributes and two will be of type Time Dimension and Measure. The time dimension | + | The dataset is built by reference to the Data Structure linked to the selected Dataflow for the chosen Data Provider. The Data Structure allows a user to define the components included in the FXL worksheet and specify whether they are coded (by reference to a codelist within the Registry). Components have types which again influences the worksheet. Types can be Dimensions, Attributes and two will be of type Time Dimension and Measure. The time dimension shows a period for a measure which is the Observational value. |
The Components can (optionally) be further refined by applying data formats and restrictions. This information is available to view in the Registry from the Data Structure list, using the '''View Data Structure Definition''' | The Components can (optionally) be further refined by applying data formats and restrictions. This information is available to view in the Registry from the Data Structure list, using the '''View Data Structure Definition''' | ||
| Line 139: | Line 139: | ||
===Mandatory Attributes=== | ===Mandatory Attributes=== | ||
| − | Will appear in Red text. In the example above, In this case, the OBS_STAUS, TIME_FORMAT and COLLECTION attributes are | + | Will appear in bold Red text if the attribute is coded, or bold Brown text if it is uncoded. In the example above, In this case, the OBS_STAUS, TIME_FORMAT and COLLECTION attributes are mandatory and coded. |
===Observation Attributes=== | ===Observation Attributes=== | ||
| Line 150: | Line 150: | ||
'''Observations with multiple attributes''' | '''Observations with multiple attributes''' | ||
| − | As shown in the example below, it is possible to include more than one attribute against | + | As shown in the example below, it is possible to include more than one attribute against each observation. |
| Line 173: | Line 173: | ||
===Long Code Lists=== | ===Long Code Lists=== | ||
Please note that if the codelsit had more than 300 codes, only the first 300 will be shown. However you can use the filter to find codes that are beyond the 300 mark. | Please note that if the codelsit had more than 300 codes, only the first 300 will be shown. However you can use the filter to find codes that are beyond the 300 mark. | ||
| + | |||
| + | ===Uncoded Components=== | ||
| + | |||
| + | Attributes which are not linked to a codelist appear on the worksheet in brown text unless they are Dimensions. Dimensions are in black text, bold if coded and normal type if they are not coded. | ||
| + | |||
| + | An example of an uncoded Attribute is shown below. | ||
| + | |||
| + | [[File:Uncoded Attribute.PNG|800px]] | ||
| + | |||
| + | |||
| + | Instead of displaying a list of codes, the Author Helper will present you with a insert box to enter data, one you press '''Insert''', the text entered will be placed into the worksheet in the selected cell. | ||
| + | |||
| + | ===Data Format=== | ||
| + | |||
| + | As well as the components which appear on a worksheet, the Data Structure allows formats to be set is Step 3 of the wizard via the '''Allowable Content''' feature. | ||
| + | |||
| + | |||
| + | [[File:Data Format Change button.PNG|900px]] | ||
| + | |||
| + | In this example you will see that the Allowable Content for the '''COLLECTION''' component has been set to Alpha Numeric. If you hover over the Details link. more information will be displayed. If the Change button is selected, you will see the restriction options available. | ||
| + | |||
| + | |||
| + | [[File:Data type and restrictions.PNG|800px]] | ||
| + | |||
| + | The format and restriction details can be seen in the Author Helper too. | ||
| + | |||
| + | [[File:Component details.PNG|500px]] | ||
=Data Set Action= | =Data Set Action= | ||
| Line 200: | Line 227: | ||
==Publish Data== | ==Publish Data== | ||
| + | ''Note: This feature is not available in FXL V3.0<br>'' | ||
| + | |||
For data providers who have been configured to publish data to the linked Fusion Registry, the Publish Data button facility can be used. This will publish the data in the current worksheet to the linked Registry, for processing, validation, and import. | For data providers who have been configured to publish data to the linked Fusion Registry, the Publish Data button facility can be used. This will publish the data in the current worksheet to the linked Registry, for processing, validation, and import. | ||
Latest revision as of 02:37, 13 September 2023
Prerequisites
To use the Data Author, you need to have installed the FXL add-in and connected to a Registry from the FusionXL tab in an Excel workbook. Click here to learn how to do that. Additionally, you will also need to Login with your Registry username and password.
The image below shows the Connected Registry along with the name of the logged in user.
Note: This section has been updated to include enhanced functionality released in Version 2.5 of FusionXL. Older versions will not work exactly as described below. To obtain the latest Version of Fusion XL, it can be downloaded from the Meta Data Technology web site in the Community Tools area.
Features Overview
These functions are grouped into two areas:
Data Set
Data sets can be created using FXL and also existing datasets (in one of the supported formats) can be loaded. The Load and Create options allow the user to use the Author Helper tool which enable a user to look up the format of the data expected including individual codes if a component has been enumerated.
Load a Data Set
To load an existing dataset, locate the file using Windows Explorer.
If the system can find details of the Provision Agreement, a pop up window will appear enabling you to select the Data Provider and the Dataflow.
Supported Formats
Supported formats are:
- SDMX-ML
- SDMX-CSV
- SDMX-JSON
- FUSION-JSON
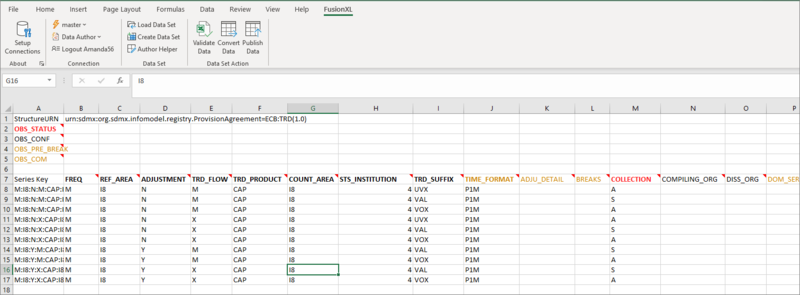
An example of a dataset (a subset of ECB:TRD taken from our demo site) is shown below.
Legend
The way the labels are displayed differs depending on the type of component and whether it is 'coded' or not. Components in a Data Structure can be linked to a Codelist to ensure that only permitted data is entered. The permitted values and be see in the Author Helper which is discussed below.
Three colours are in use along with bold text:
| Colour | Used for |
|---|---|
| Black | Coded Attributes which are not mandatory. Time and Measure Components |
| Black + Bold | Coded Dimensions |
| Brown | Uncoded Dimensions and Attributes) |
| Brown + Bold | Mandatory Uncoded Attributes and Uncoded Dimensions |
| Red + Bold | Mandatory Coded Dimensions and Attributes |
Once the dataset is loaded, it can be edited, saved and loaded into a Fusion Registry.
Create Data Set
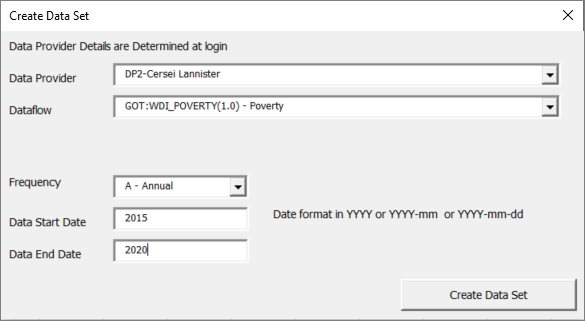
This option allows a logged in user (with the appropriate permissions) to create a dataset for a Provision Agreement held in the connected Registry.
Once this option is selected new window will open enabling you to choose from the Provision Agreements held on the connected Registry as shown in the example below.
This window is also used to provide further information such as the Frequency, Start date and End date.
This is used to build a dataset which is performed once Create Data Set is selected.
A simple example is shown below.
The above example contains a header row (row 1).
An Observation Attribute in row 2.
Row 4 shows the Coded Dimensions included in the Data Structure together with the Time Periods selected in the previous step.
The red indicators show that more information is available using the Note or Comment Excel feature (depending on which version of MS Excel you are using) and will reveal more information regarding the component.
The dataset is built by reference to the Data Structure linked to the selected Dataflow for the chosen Data Provider. The Data Structure allows a user to define the components included in the FXL worksheet and specify whether they are coded (by reference to a codelist within the Registry). Components have types which again influences the worksheet. Types can be Dimensions, Attributes and two will be of type Time Dimension and Measure. The time dimension shows a period for a measure which is the Observational value.
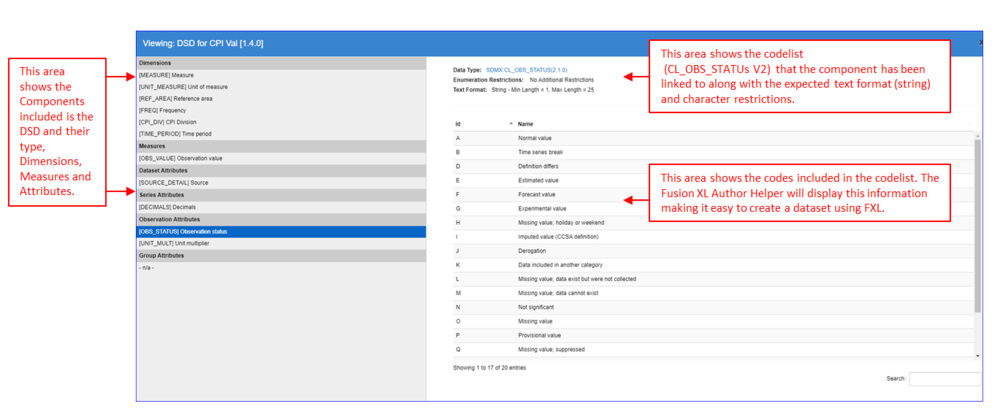
The Components can (optionally) be further refined by applying data formats and restrictions. This information is available to view in the Registry from the Data Structure list, using the View Data Structure Definition Button, which will reveal a view similar to that shown below.
The Data Structure also enables the attributes to be set to Mandatory. If an attribute is Mandatory it will have a heading in bold Red on the worksheet (if it is a coded component) or bold Brown if uncoded. Mandatory components will also be indicated thus in the view Dataflow option.
The various types of Attributes are discussed in the Author Helper section below.
Data can be entered manually or via the Author Helper discussed below.
Author Helper
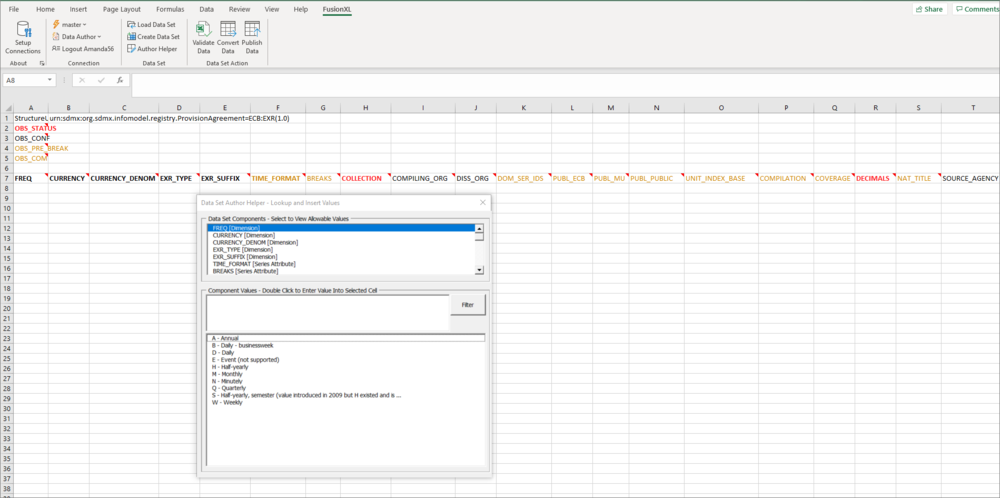
The Author Helper is an extremely useful tool which allows you to see the Components and allowable Codes expected based on the Dataflow and Data Provider combination. If codelists have been restricted based on the Dataflow or Data Provider, then the Author Helper will not include disallowed codes.
When selecting a Component in the Author Helper, the selected cell in the Excel worksheet will be automatically selected in the current row. Double clicking on a value in the Component Values section will automatically populate the current cell with the Code Id.
An example is shown below.
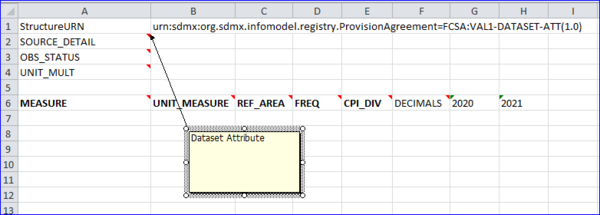
Dataset Attributes
Dataset attributes set a single value for the entire dataset.
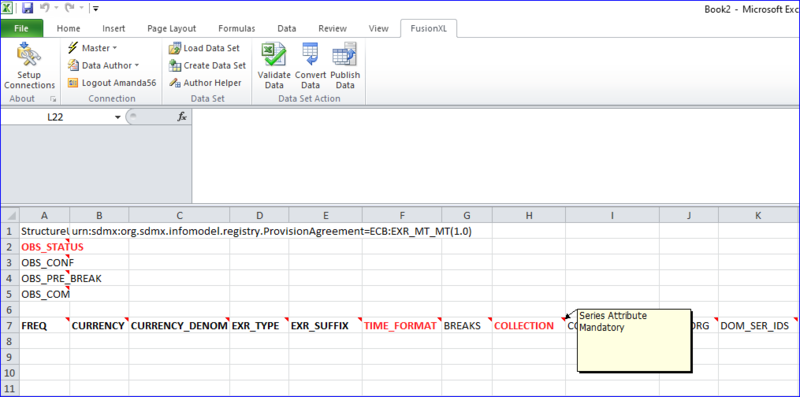
Series Attributes
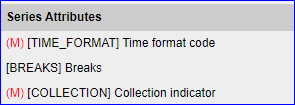
Series Attributes will appear in a column along with the dimensions as shown in the example below.
Mandatory Attributes
Will appear in bold Red text if the attribute is coded, or bold Brown text if it is uncoded. In the example above, In this case, the OBS_STAUS, TIME_FORMAT and COLLECTION attributes are mandatory and coded.
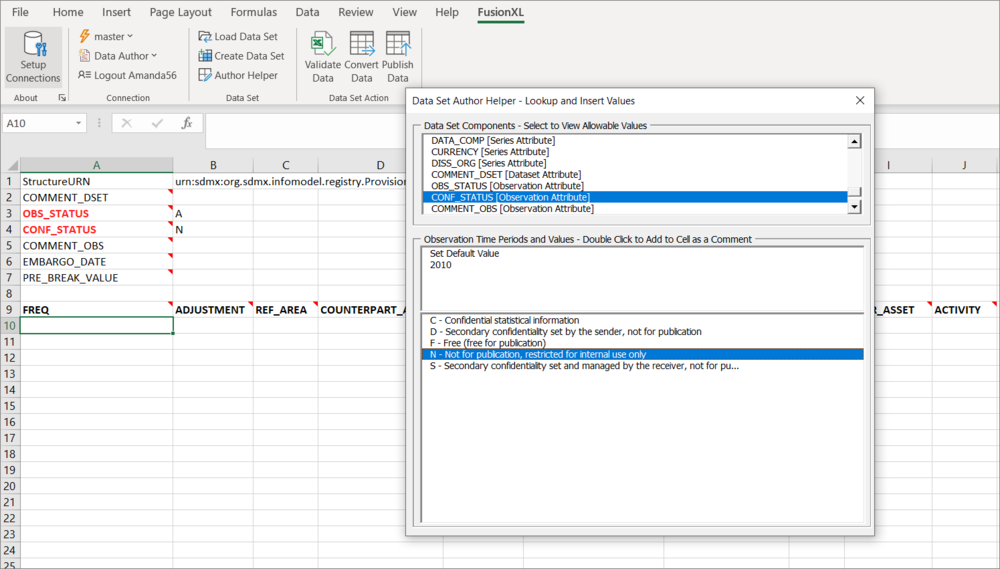
Observation Attributes
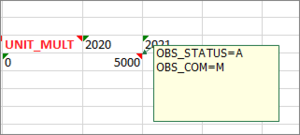
For observation attributes, the dataset author helper will also include the options to choose an observation time, or set the default value. If setting a value on the observation, then it will be inserted as a Cell comment (or note depending on the version of Excel), this is shown in the image below.
Observations with multiple attributes As shown in the example below, it is possible to include more than one attribute against each observation.
Default Observation attribute
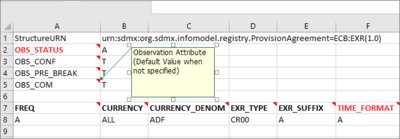
If a data set has many observations which have the same observational attribute code, a default can be entered in the rows below the header as shown in the example below.
Using the Filter
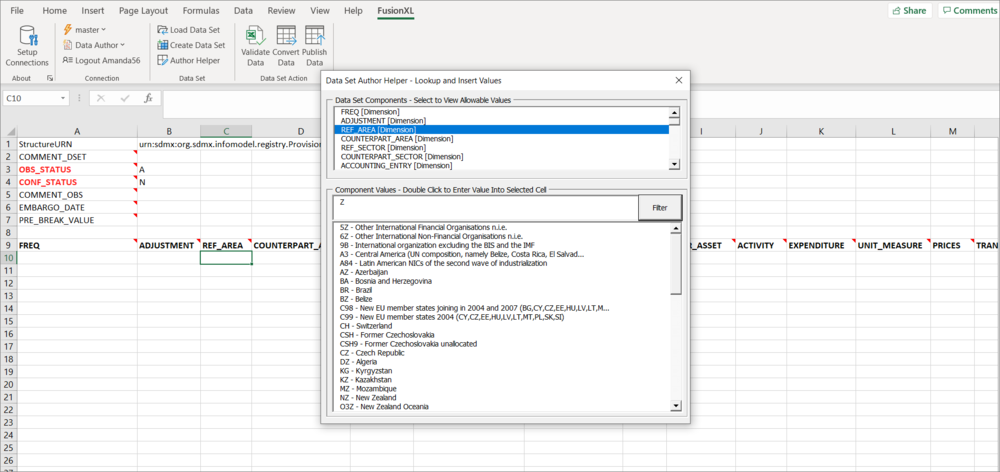
If the codelist used in a dimension etc has many possible codes, you can use the filter to help you find a code as shown in the example below.
First, select the Component (in this case REF_AREA) that you want to search on, next enter refine your search. In this example Z has been entered to search for all codes which contain 'z' in either the ID or description. Matches are displayed when the Filter button is clicked.
Long Code Lists
Please note that if the codelsit had more than 300 codes, only the first 300 will be shown. However you can use the filter to find codes that are beyond the 300 mark.
Uncoded Components
Attributes which are not linked to a codelist appear on the worksheet in brown text unless they are Dimensions. Dimensions are in black text, bold if coded and normal type if they are not coded.
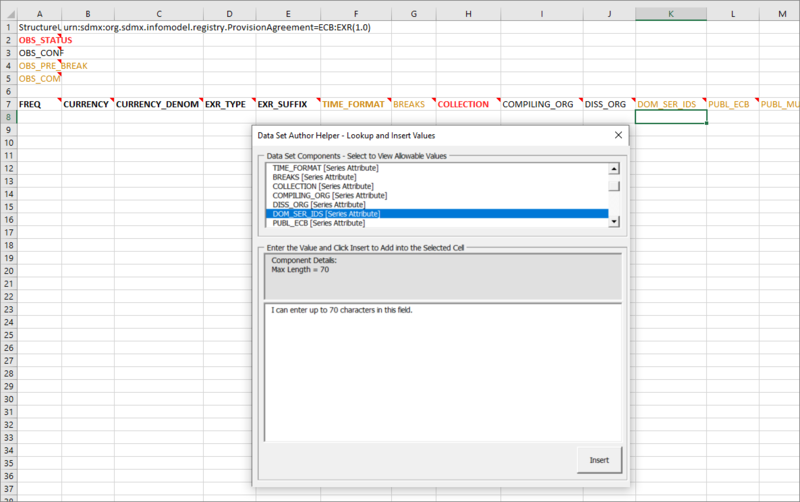
An example of an uncoded Attribute is shown below.
Instead of displaying a list of codes, the Author Helper will present you with a insert box to enter data, one you press Insert, the text entered will be placed into the worksheet in the selected cell.
Data Format
As well as the components which appear on a worksheet, the Data Structure allows formats to be set is Step 3 of the wizard via the Allowable Content feature.
In this example you will see that the Allowable Content for the COLLECTION component has been set to Alpha Numeric. If you hover over the Details link. more information will be displayed. If the Change button is selected, you will see the restriction options available.
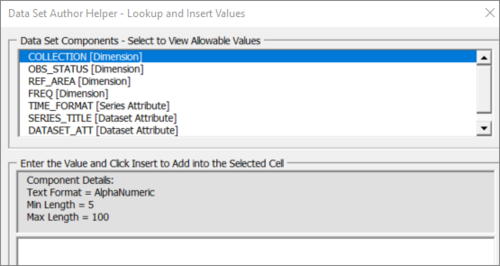
The format and restriction details can be seen in the Author Helper too.
Data Set Action
Validate Data
Once a dataset has been loaded, or authored, in FusionXL, it can be validated.
To validate a dataset, click on the Validate button. FusionXL will then check the Validation rules set up in the connected Registry and, if valid, you will be advised that the validation process has been successful.
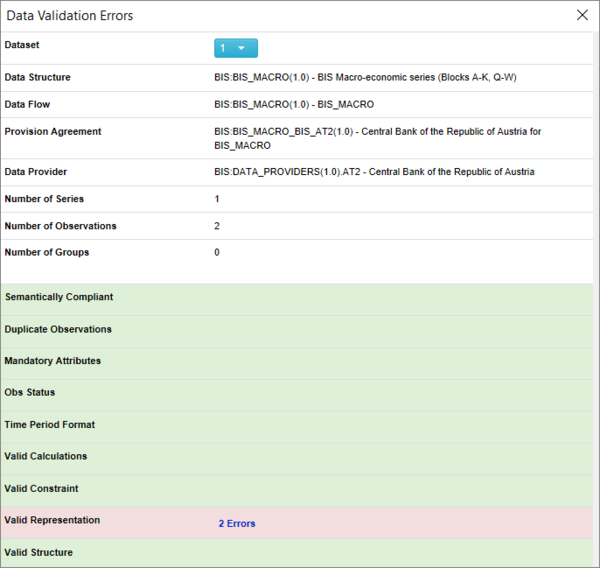
If the dataset is valid, a small window will open to indicate there were no errors. If the dataset fails validation, a validation report will be opened, as shown in the image below.
Invalid Datasets
If the dataset fails the Validation process, a validation report will be opened, as shown in the image below.
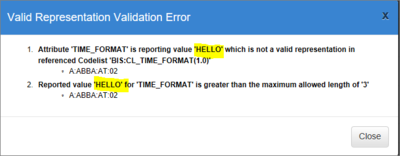
To view the error, simply click on the Validation error and you will see what has failed.
In order to successfully publish a dataset, fix the validation issues.
Convert Data
This option allows you to convert the data into one of the supported formats which will be listed in Export Format box. An option Sender ID can be added if required and will be included in the file Header.
Publish Data
Note: This feature is not available in FXL V3.0
For data providers who have been configured to publish data to the linked Fusion Registry, the Publish Data button facility can be used. This will publish the data in the current worksheet to the linked Registry, for processing, validation, and import.
Before the data is published, you should use the Validate option to ensure that the data in the FXL sheet is acceptable.


