Difference between revisions of "Series Configuration"
| (7 intermediate revisions by the same user not shown) | |||
| Line 1: | Line 1: | ||
| − | + | [[Category:FDB Install and Configure]] | |
| − | [[Category: | ||
| − | |||
= Overview = | = Overview = | ||
The Series List configuration describes how each Time Series will be displayed in a list to the user, in terms of the Labels and Filters used. | The Series List configuration describes how each Time Series will be displayed in a list to the user, in terms of the Labels and Filters used. | ||
| Line 67: | Line 65: | ||
= Examples = | = Examples = | ||
| − | File:Example 1- Dataflow ECB - TRD.PNG | + | ==Example 1 - Dataflow ECB:TRD(1.0)== |
| + | |||
| + | [[File:Example 1- Dataflow ECB -seriesconfig - TRD.PNG|thumb|Example 1 - Configuration settings]] | ||
| + | |||
| + | [[File:Example 1- Dataflow ECB - TRD.PNG|thumb|Example 1 - effect]] | ||
| + | |||
| + | |||
| + | |||
| + | |||
| + | |||
| + | |||
| + | |||
| + | |||
| + | |||
| + | |||
| + | |||
| + | |||
| + | |||
| + | |||
| + | |||
| + | |||
| + | |||
| + | |||
| + | |||
| + | |||
| + | |||
| + | |||
| + | |||
| + | |||
| + | |||
| + | <br> | ||
| + | |||
| + | ==Example 2 - Dataflow WB:WDI_POVERTY(1.0)== | ||
| + | |||
| + | [[File:Example 2- Dataflow WB - WDI-POVERTY-seriesconfig.PNG|thumb|Example 2 - Configuration settings]] | ||
| + | |||
| + | [[File:Example 2- Dataflow WB - WDI-POVERTY.PNG|thumb|Example 2 - effect]] | ||
| + | |||
| + | |||
| + | |||
| + | |||
| + | |||
| + | |||
| + | |||
| + | |||
| + | |||
| + | |||
| + | |||
| + | |||
| + | |||
| + | |||
| + | |||
| + | |||
| + | |||
| + | |||
| + | |||
| + | |||
| + | |||
| + | |||
| + | |||
| + | |||
| + | |||
| + | <br> | ||
| + | ==Example 3 - Dataflow Undefined (using Default)== | ||
| + | |||
| + | [[File:Example 3- Dataflow undefined-seriesconfig.PNG|thumb|Example 3 - Configuration settings]] | ||
| + | |||
| + | [[File:Example 3- Dataflow undefined.PNG|thumb|Example 3 - effect]] | ||
Latest revision as of 02:39, 17 November 2025
Contents
Overview
The Series List configuration describes how each Time Series will be displayed in a list to the user, in terms of the Labels and Filters used.
Each series cen be described by up to three level of title, the main TItle, the Sub Title and the Footer. In addition the Series list contains a high level set of filters the the user can use to refine the list. These are Quick Filters. The user has the option to use the advanced filter control which provides a richer interface for filtering the time series.
The properties file is called seriesconfig.json and is found in the properties folder. It will look something like this:
 "Default": {
   "Title": "${REF_AREA}",
   "SubTitle": "${SERIES}",
   "Footer" : "Time Series Range:${T} Frequency: ${FREQ}",
   "QuickFilters" : "all"
 },
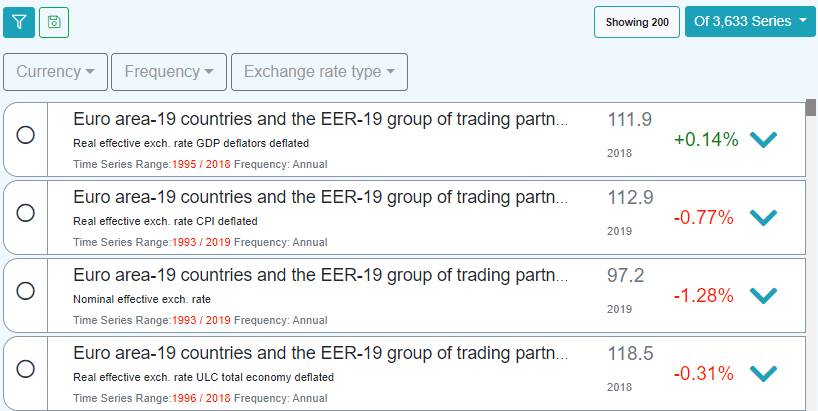
 "Dataflow=ECB:TRD(1.0)": {
   "Title": "${TRD_PRODUCT} with ${COUNT_AREA} - ${TRD_FLOW} ${TRD_SUFFIX},${ADJUSTMENT}",
   "SubTitle": "${REF_AREA}",
   "Footer" : "Time Series Range:${T}  Frequency: ${FREQ}",
   "QuickFilters" : "all"
 },
Default Display
"Default": {
   "Title": "${REF_AREA}",
  ...
There is a high level default display that can be applied to all Datasets that do not have a specific configuration.
Dataset Specific Display
 "Dataflow=ECB:TRD(1.0)": {
   "Title": "${TRD_PRODUCT} with ${COUNT_AREA} - ${TRD_FLOW} ${TRD_SUFFIX},${ADJUSTMENT}",
 ...
This is the display configured for a specific dataset, defined by the partial URN syntax Dataflow=ECB:TRD(1.0).
Titles
There are three level of title: Title, SubTitle, and Footer, each property is optional. Each property can contain a mixture of text, variables, and HTML markup.
Variables
Variables include a Dimension or Attribute identifier in the following syntax ${REF_AREA}. This will be replaced by the label of the Reference Area for the given series, for example an output may be 'Japan'. The variable ${T} can be used for time, and is replaced with the time range for the series in the syntax [start period]/[end period], for example 1991-Q1/2001-Q4.
If the Dimension or Series Attribute has no corresponding value in the dataset, then it will be omitted from the label. For example
"SubTitle": "${VARIABLE}, ${POWERCODE}, measured in ${UNIT}, for ${REFERENCEPERIOD}"
If POWERCODE and REFERENCE PERIOD have no value, then the above example could result in the following text:
Consumption per Capita, ,measured in Kg, for
To prevent the inclusion of commas and other text between placeholders that have no value, the syntax supports the ability to include text if the variable is present, or not present, and is as follows:
${DIMENSION_ID:[Text if not present]:[Preceding text if present]:[Following text if present]}
For example, the following would ensure the that ‘, for’ text only appears if the REFERENCEPERIOD placeholder resolves to a value for the series.
${REFERNCEPERIOD::, for:}
The following example shows how the ‘preceding text is present’ rule is used to display optional series attribute values.
"SubTitle": "${VARIABLE}, ${POWERCODE} ${UNIT:: measured in} ${REFERENCEPERIOD:: for:}"
It is important to note that the colon delimiters are optional, and are not all required. In the above example, the VARIABLE placeholder does not require any additional ‘if not present’ information, so the colon delimiters are not required
HTML Markup
Any HTML markup can be include in the title, and it will be rendered according to the HTML specification. For example
<b>this is bold</b>
will be replaced with bold text.
Examples
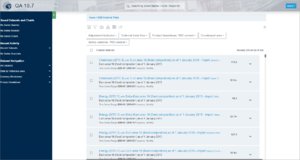
Example 1 - Dataflow ECB:TRD(1.0)
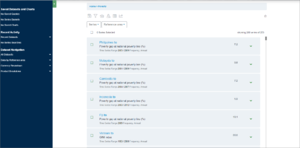
Example 2 - Dataflow WB:WDI_POVERTY(1.0)


