Difference between revisions of "Fusion-Excel-Table"
m (Mnelson moved page Fusion Excel Table to Fusion-Excel-Table) |
|||
| (3 intermediate revisions by one other user not shown) | |||
| Line 1: | Line 1: | ||
[[Category:SdmxDataFormat]] | [[Category:SdmxDataFormat]] | ||
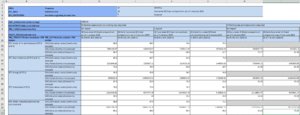
| + | [[File:Excel-table.png|thumb|Time and Counterpart Area Dimensions in rows]] | ||
| + | [[File:Excel-table 2.png|thumb|Pivot to show prodcuts in the rows and time in the header]] | ||
=Overview= | =Overview= | ||
The Fusion-Excel-Table format is not an official SDMX format. It outputs the dataset as a table, where the Dimension placement (rows/columns) can be defined dynamically. | The Fusion-Excel-Table format is not an official SDMX format. It outputs the dataset as a table, where the Dimension placement (rows/columns) can be defined dynamically. | ||
The Dimension can either take one of the following placements: | The Dimension can either take one of the following placements: | ||
| − | * Header - The dimension values iterate over the column in the table, i.e column 1 is USD column 2 is GBP. Multiple Dimensions can be | + | * Header - The dimension values iterate over the column in the table, i.e column 1 is USD column 2 is GBP. Multiple Dimensions can be assigned to the row |
| − | * Row - The dimension values iterate over the rows in the table, i.e row 1 is USD row 2 is GBP. Multiple Dimensions can be | + | * Row - The dimension values iterate over the rows in the table, i.e row 1 is USD row 2 is GBP. Multiple Dimensions can be assigned to the row |
* Slice - one dimension can become a slice, a worksheet will be output per slice value, e.g slice by FREQ would output Annual Data in one worksheet, Monthly data in another, and so on. | * Slice - one dimension can become a slice, a worksheet will be output per slice value, e.g slice by FREQ would output Annual Data in one worksheet, Monthly data in another, and so on. | ||
* Fixed - determined by the system on output, if the Dimension has a fixed value it is either promoted to the fixed header section or removed from the output (defeined by the user) | * Fixed - determined by the system on output, if the Dimension has a fixed value it is either promoted to the fixed header section or removed from the output (defeined by the user) | ||
| Line 20: | Line 22: | ||
! Query Parameter !! Values !! Description | ! Query Parameter !! Values !! Description | ||
|- | |- | ||
| − | | format || | + | | format || excel-table || Required to output the dataset in fusion-excel-series format |
|- | |- | ||
| detail || '''full''' or '''dataonly''' <br/> default full|| Use '''dataonly''' to exclude series attributes from the output | | detail || '''full''' or '''dataonly''' <br/> default full|| Use '''dataonly''' to exclude series attributes from the output | ||
Latest revision as of 07:06, 19 August 2020
Overview
The Fusion-Excel-Table format is not an official SDMX format. It outputs the dataset as a table, where the Dimension placement (rows/columns) can be defined dynamically.
The Dimension can either take one of the following placements:
- Header - The dimension values iterate over the column in the table, i.e column 1 is USD column 2 is GBP. Multiple Dimensions can be assigned to the row
- Row - The dimension values iterate over the rows in the table, i.e row 1 is USD row 2 is GBP. Multiple Dimensions can be assigned to the row
- Slice - one dimension can become a slice, a worksheet will be output per slice value, e.g slice by FREQ would output Annual Data in one worksheet, Monthly data in another, and so on.
- Fixed - determined by the system on output, if the Dimension has a fixed value it is either promoted to the fixed header section or removed from the output (defeined by the user)
Fusion-Excel-Table can be a read/write format, meaning the dataset can be modified and read back in by the Fusion Registry. However by default the format is read only unless it is explicitly asked to be read/write, this is because the additional information written to the workbook to make it read/write can slow down the performance when opening the workbook in Excel.
Fusion-Excel-Table became available from Fusion Registry v10.4.5 onwards
Formatting Using Query Parameters
The following URL parameters can be used in a RESTful query for to get data in Excel format.
| Query Parameter | Values | Description |
|---|---|---|
| format | excel-table | Required to output the dataset in fusion-excel-series format |
| detail | full or dataonly default full |
Use dataonly to exclude series attributes from the output |
| slice | [dimension id] default to N/A |
If provided, an Excel worksheet will be created for each distinct value in the dataset for this Dimension |
| labels | id or name or both (id is default) |
Output Ids or the corresponding name, or id and name |
| fixed | keep or promote or remove (promote is default) |
Describes how to handle Dimension or Series Attribute values which are the same for the whole dataset.
|
| readable | true or false default false |
if true the output workbook will contain additional metadata to enable the Fusion Registry to read the dataset back in meaning the data can be modified for re-submission |
| header | comma separated list of Dimension Ids | the dimensions assigend to the table header |
| rows | comma separated list of Dimension Ids | the dimensions assigend to the table rows |
Note: The same formatting can be applied using HTTP Accept Headers as opposed to using REST query parameters.

