Difference between revisions of "Data Browser Time Series Chart"
Jump to navigation
Jump to search
| (3 intermediate revisions by the same user not shown) | |||
| Line 1: | Line 1: | ||
| − | |||
[[Category:Fusion Data Browser]] | [[Category:Fusion Data Browser]] | ||
| − | |||
==Overview== | ==Overview== | ||
| − | |||
| − | |||
| − | |||
| − | |||
To access a Series Chart you need to open a Dataset in the Series List. | To access a Series Chart you need to open a Dataset in the Series List. | ||
| Line 14: | Line 8: | ||
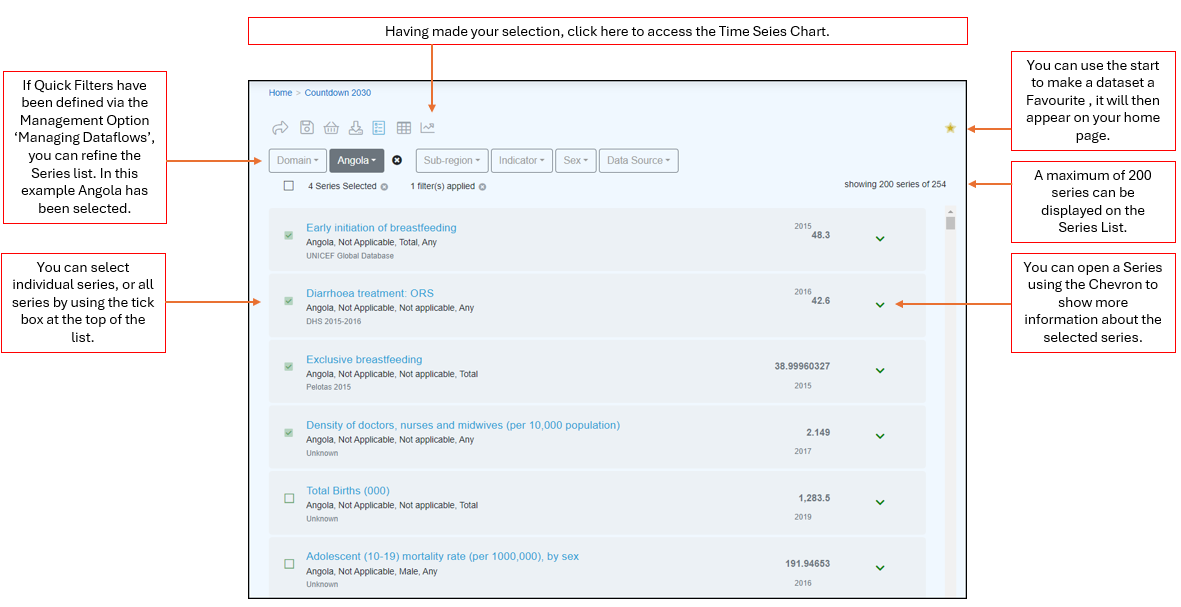
The Series List allows you to define what is to be included in the Time Series Chart. | The Series List allows you to define what is to be included in the Time Series Chart. | ||
| + | |||
[[File:FDB-TS-Chart1.png|1200px]] | [[File:FDB-TS-Chart1.png|1200px]] | ||
| − | Once selected, the Time Series chart will open, the example below is for ''' | + | Once selected, the Time Series chart will open, the example below is for '''External Trade - all periods''' which can be viewed on the [https://demo11.metadatatechnology.com/FusionDataBrowser/?share=N4IglgJiBcIMQGMAWBDATgFxAGhBgngA4CmMIAKmALbEDKxaYxAzgMKqY4gCOArg-higAiv0YsYAbVCQyEAOwBOAAzyAbAA5FAWgTri2gCwaAZid0BmQ8u0AmZScNrbKDQkUAjAIxcIKDCgmADYA9gDuQiAoAObEAHYI+ACSULAAoqwAQlyysOQASgAiXABuDMxgIXFkXgB0yiAAvrjMDEzMUiAAsrVJGrUAcrUAGrW25Ia9-ZMAagCCADJcPX21AJq1PawA8kOrs9vDy1ODI7Vq5OS1ANLKtQdHuCv9Gz2XV-kAqve180tPJw2ox2PQAUtNfotjqsgbV3rUAGJqH5-aH9IajbZJBa1cE-T4zR7dE5DN6XE4PNGnTHY3EQmaHKkY3oDK77X6MgEws7Kcm3FFQrkvTZjCY3O6UoXrEWsOYABXFAv+xNWpNFkzxs0FKvRIt5dU1kOVz1OPXkfIlRqZZ1lCv5kwJRJNrzh5IA4pklVSXea2fTOTrpT19YrJYHmYpyYbUVLYRd+vaOU6STLdqGrbGzl05kNEzHA7CsTj2fmTcz43SvVK1RW8wGy2dfenHdbRvDQQqtcaU1ttmD6dqG2Srkiq+GRdnc5bS4CRfDhPIxw3RiHDS3M6MLBal7PgWm84OU23yWlJl3W7UAKzbh2E609WuW9cFs5JVmVsPOkXXv0o+u9RQg1dK5WAACR3blhw-JMLx-dMGWTVUbXlaCZyQlZ32jf8kNGN9f1vRDdVGcYNX9QjTWAilamfL8oMyWwIOFFdyANAduxw2odinfE72rM4LiuRMaJ7Wot0E6dD3Q+obwzcc9xNc8+OY1i-3ItU8Og4SOKbOtyNheES2w4UH3IBMJPYpj1VQySiM4-dpyM6lKIRBjFPHLYUIPCyKJI+DHNhScqIQi9I3w2TlxZcTGKcwLdO9OdyUMtSbT7VDHOZMTm14uSrLXbKhysoT8t3WodPM6FAJdeFPloaKXV86MbIokMiuSno4PZLTjNKmS0N1KC8rayiPWitUmySi9Mrijdzl6pqXVXNiKoo+FCmuUaRXGiEuqc3kooI+9pLqaaX3kvy9Nfd8S3ms44K8i89vOi9DDm7z1KupalJ6q5Gre1Melai8K2u7yXUCia+J6cGyPijCwr66Vjw+b43IiosqJ25l0Yh9yr1e2G8f28KROhnihoE+CmuZODfoJin7szXsAYci7N0SmHIbs5nVIvDR8a++EToK9Hac5zLOuKyDahFz6ctip9JdskFNMVpyvBkzGznGImEeZdWdfSkVxY5l8emNnmZplurkLtcqZt8oXZ17IYsKGjTRZykMJaGwLXfipHagXDaPIVHHaMip7GdE9ng9qULKb+gOAC1L1j33ttVtVbQxzOzkFhXWaOyPTcJtKLqg2g0lj9HHY49ONuIsUw5EzLBovbOQaB0yy-94bPVRkqtotz2WKCw22Z+2WCtbk3w9W9aB6lh27dO0vm44+EwOtgO-c5gyp5KjvZ5K+vPxE+dF0X7qWpXiKuITi8a9vo8rO9rv+jbr7lfX7qh6voDBaAX-i6bOu9V6Pljh1Y+3IA6dz3lGaB-Vpa0kBjNeE9FrZMzHkNdBrliYwLjvzEu7YD5SygdvCOHsvw0hxLXJBED-7MmqrVRhIoNKoJyqAxBTk-74O6kfYeBV75vyjvHBmuNzbALODPQRIl2EswJqfGCABdRoyjcDbBIGgfwlQ4gdGgMAZoIBWAhAgHQYgQRiAIAwLo-RhijFBGoGALA0B7AtAQGgEIQQggAA8yAeBCBgDAIQqBcGiJ43ghATG8DiC4y8yhlC4D8BgYgCIQhoCoP4SIKA4hxF4CgIIZB8DFMEEklAYAgiCFgBACA2guhdG0CU0pIAqBVAwEgSpZB6kNKaU0RoQ| Demo site]. |
[[File:Time Series Example External Trade 1.png|1000px]] | [[File:Time Series Example External Trade 1.png|1000px]] | ||
| + | |||
You can use the [[Dataset_Period| Dataset Period button]] to refine the period displayed. | You can use the [[Dataset_Period| Dataset Period button]] to refine the period displayed. | ||
Latest revision as of 08:11, 24 October 2024
Overview
To access a Series Chart you need to open a Dataset in the Series List.
The Series List allows you to define what is to be included in the Time Series Chart.
Once selected, the Time Series chart will open, the example below is for External Trade - all periods which can be viewed on the Demo site.
You can use the Dataset Period button to refine the period displayed.
You can use the Table filters to reline the data included in the Time Series Chart.
A full list of features available in the Time Series Chart can be found here. .


