Difference between revisions of "Data Browser Table Chart"
| (6 intermediate revisions by the same user not shown) | |||
| Line 1: | Line 1: | ||
| − | |||
[[Category:Fusion Data Browser]] | [[Category:Fusion Data Browser]] | ||
| − | |||
==Overview== | ==Overview== | ||
To access a Table Chart you need to open a Dataset in the Series List. | To access a Table Chart you need to open a Dataset in the Series List. | ||
| Line 17: | Line 15: | ||
[[File:FDB-Table-Chart2.png|1000px]] | [[File:FDB-Table-Chart2.png|1000px]] | ||
| + | |||
| + | ==Toolbar== | ||
| + | The functions available from the Toolbar are detailed [[A_beginners_guide_to_Fusion_Data_Browser#Functions_available|in this article]]. | ||
| + | |||
| + | |||
| + | [[File:FDB-Table-Chart4.png|1200px]] | ||
| + | |||
| + | |||
| + | ==Columns== | ||
| + | The columns appearing are as defined in the Dataset’s Data Structure. You can change which columns are displayed in your Chart using the Column Tab. | ||
| + | |||
| + | |||
| + | [[File:FDB-Table-Chart5.png|1200px]] | ||
| + | |||
| + | The effect of any changes will immediately be seen on the grid. | ||
| + | |||
| + | ==Filters== | ||
| + | The filters are a combination of what is defined in the Data Structure and take into account what data is present in the Dataset. | ||
| + | |||
| + | [[File:FDB-Table-Chart6.png|1200px]] | ||
| + | |||
| + | The effect of any changes will immediately be seen on the grid. | ||
| + | |||
| + | ==Other Features== | ||
| + | Fusion Data Browser uses the Community edition of AG Grid. You can learn more about Pivot Mode, Row Groups and Values from the [https://www.ag-grid.com/example/ AG Grid Web site]. | ||
Latest revision as of 08:10, 24 October 2024
Overview
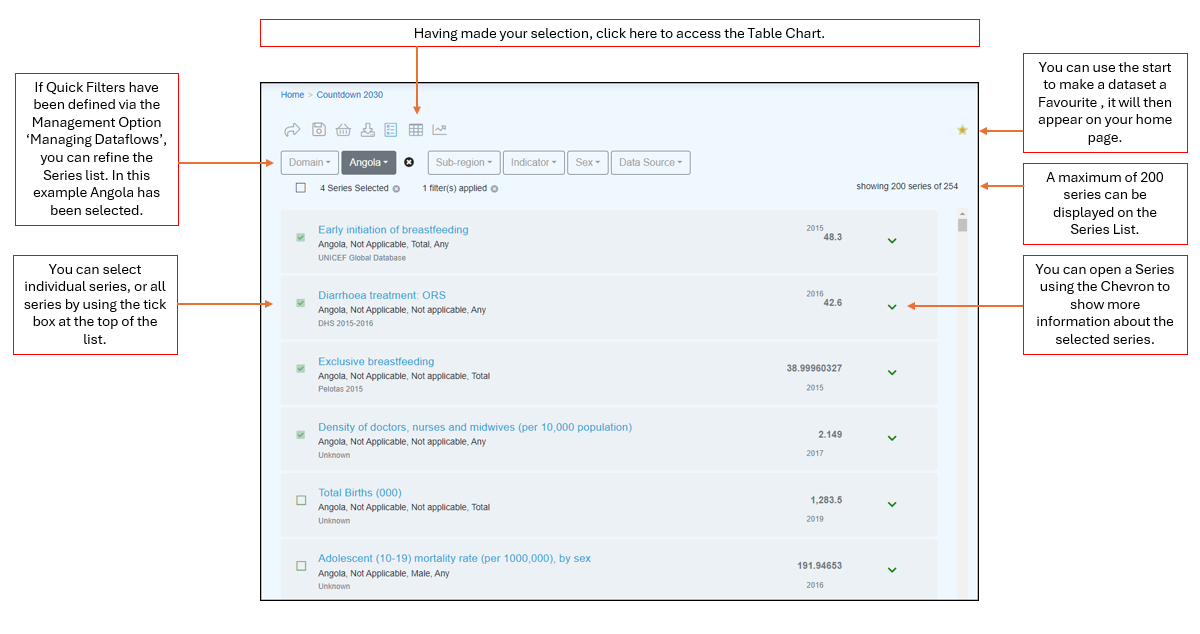
To access a Table Chart you need to open a Dataset in the Series List.
The Series List allows you to define what is to be included in the Table Chart.
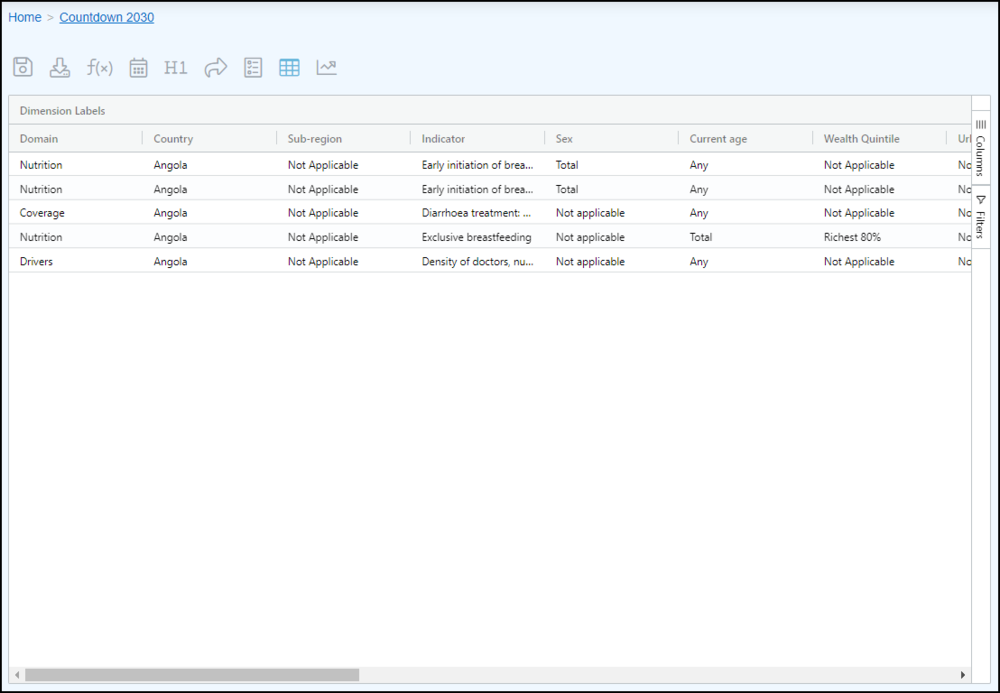
Having clicked the Table button, it will open as shown in the example below.
Toolbar
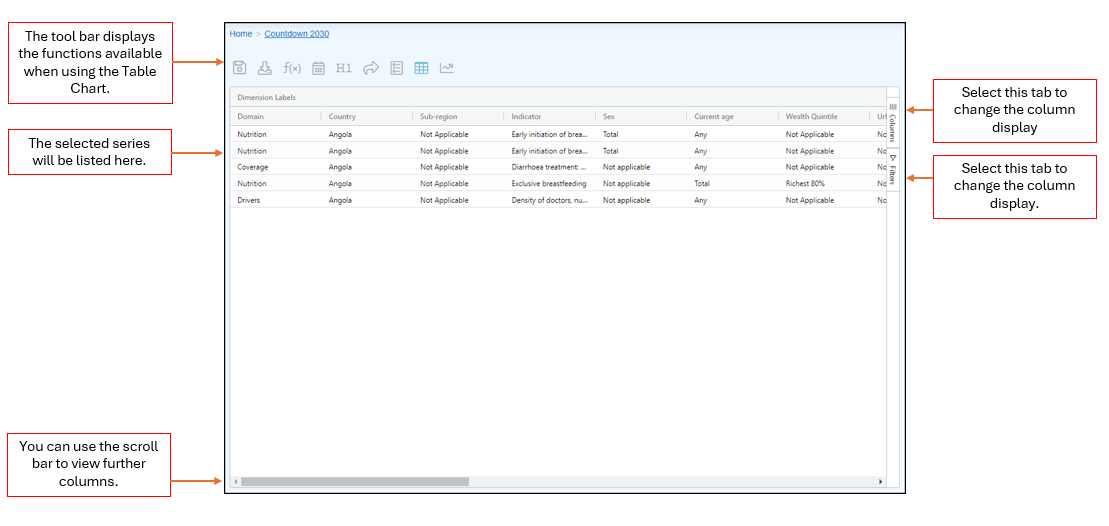
The functions available from the Toolbar are detailed in this article.
Columns
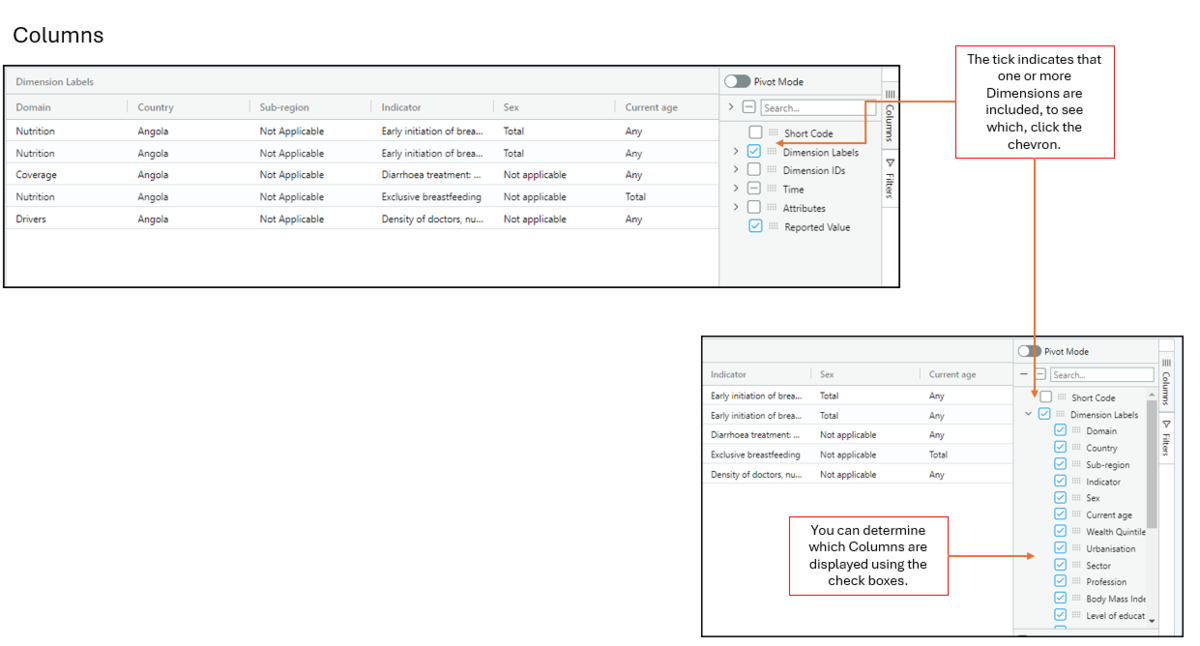
The columns appearing are as defined in the Dataset’s Data Structure. You can change which columns are displayed in your Chart using the Column Tab.
The effect of any changes will immediately be seen on the grid.
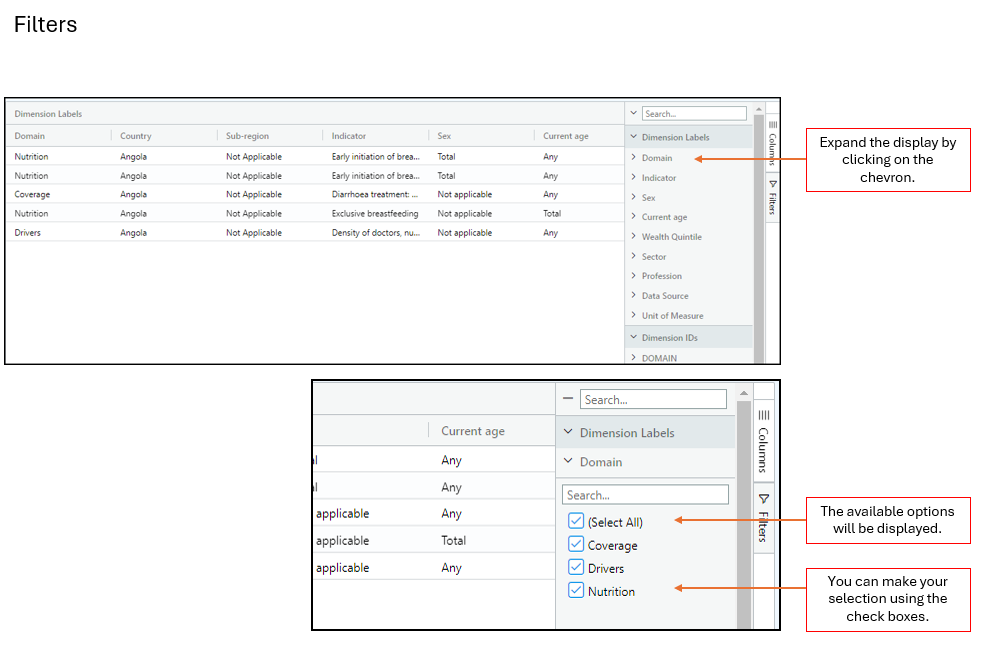
Filters
The filters are a combination of what is defined in the Data Structure and take into account what data is present in the Dataset.
The effect of any changes will immediately be seen on the grid.
Other Features
Fusion Data Browser uses the Community edition of AG Grid. You can learn more about Pivot Mode, Row Groups and Values from the AG Grid Web site.

