Difference between revisions of "Data Browser Calculations"
(→Table Chart) |
(→Options) |
||
| Line 14: | Line 14: | ||
==Options== | ==Options== | ||
| + | ===Percentage Change=== | ||
| + | There are no additional options, just on or off. | ||
| + | ===Moving Average=== | ||
| + | You can select the number of periods to be used in the calculation. | ||
| + | |||
| + | |||
| + | [[File:FDB-Table-Chart-Moving Average.JPG|500px]] | ||
| + | |||
| + | |||
| + | ===Precision=== | ||
| + | Enables you to set the number of decimal places. | ||
| + | |||
| + | |||
| + | [[File:FDB-Table-Chart-Precision.JPG|500px]] | ||
| + | |||
| + | |||
| + | ====Interpolate=== | ||
| + | |||
| + | There are no additional options, just on or off. | ||
| + | |||
| + | ===Convert Frequency=== | ||
| + | |||
| + | You can use this to convert all rows to the selected Frequency. | ||
| + | |||
| + | [[File:FDB-Table-Chart-Convert-Frequency.JPG|500px]] | ||
| + | |||
| + | |||
| + | In addition there is an Aggregate Function which presents further options which can be used in the calculation. | ||
| + | |||
| + | [[File:FDB-Convert-Frequency-Aggregate.JPG|500px]]. | ||
==Table Chart== | ==Table Chart== | ||
Revision as of 07:57, 24 October 2024
Overview
The Calculations Button ![]() is available on the Table and Time Series Charts toolbar and is also one of the Export Data features for certain formats.
is available on the Table and Time Series Charts toolbar and is also one of the Export Data features for certain formats.
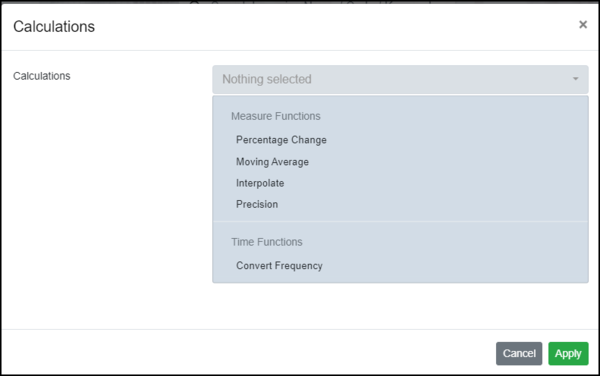
Clicking on the the button will display the options available.
One or more options can be chosen.
Note - certain options work with a Frequency dimension and if the system does not find a dimension for Frequency in the associated Data Structure, you will be presented with a list of dimensions enabling you to nominate a substitute.
Options
Percentage Change
There are no additional options, just on or off.
Moving Average
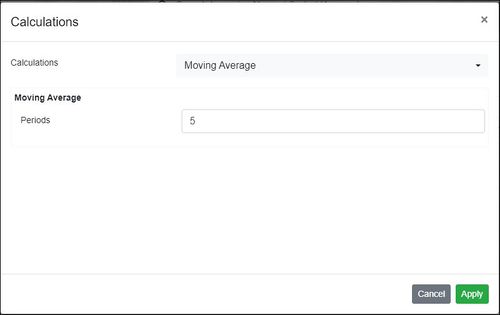
You can select the number of periods to be used in the calculation.
Precision
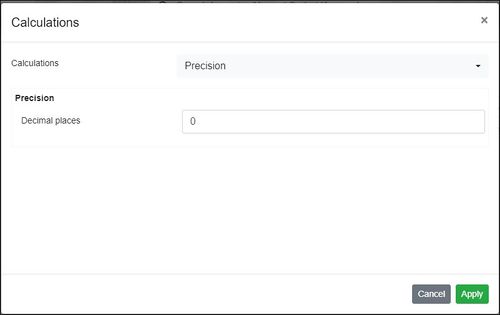
Enables you to set the number of decimal places.
=Interpolate
There are no additional options, just on or off.
Convert Frequency
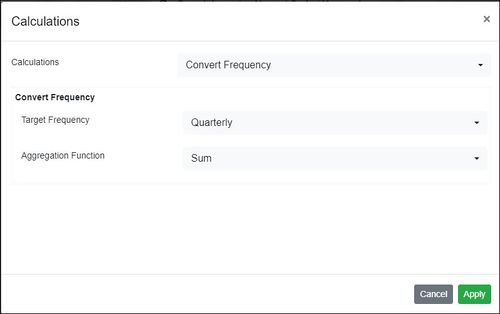
You can use this to convert all rows to the selected Frequency.
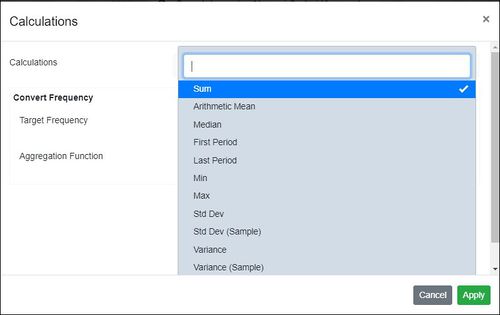
In addition there is an Aggregate Function which presents further options which can be used in the calculation.
Table Chart
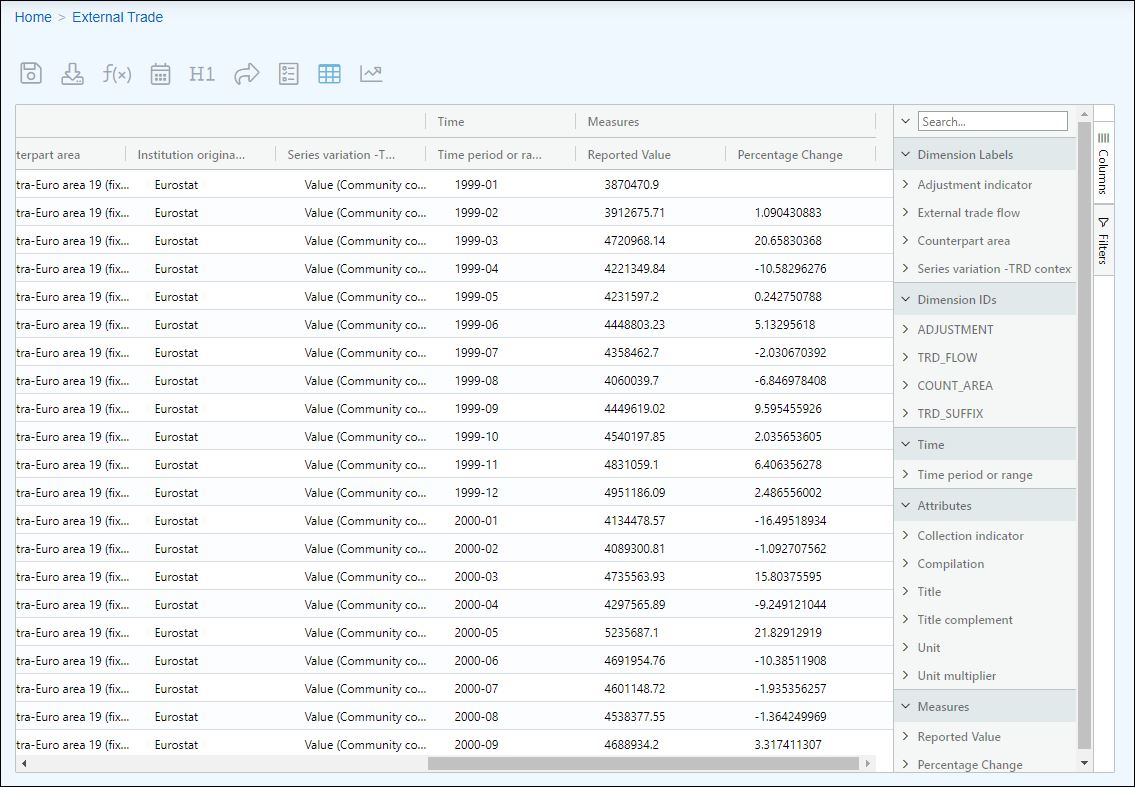
Using External Trade which is available from the demo site adding a function such as % change will have the effect of adding another column as shown in the example below.
Series Chart
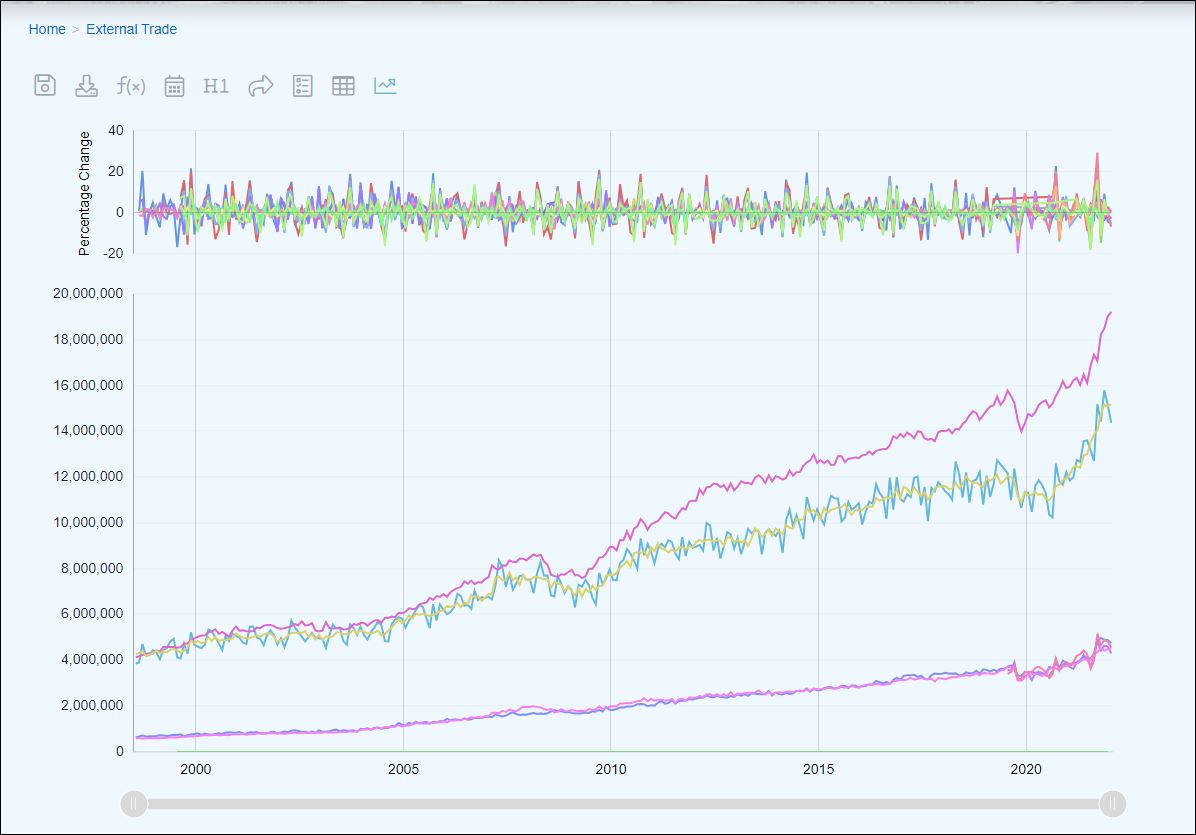
In the example below, again using a series chart available on the Demo site you can see at the top of the chart, additional information.
