Difference between revisions of "Data Browser Table Chart"
Jump to navigation
Jump to search
m (Vmurrell moved page Data Browser Table to Data Browser Table Chart) |
|||
| Line 2: | Line 2: | ||
[[Category:Fusion Data Browser]] | [[Category:Fusion Data Browser]] | ||
[[Category:FDB Functions]] | [[Category:FDB Functions]] | ||
| + | ==Overview== | ||
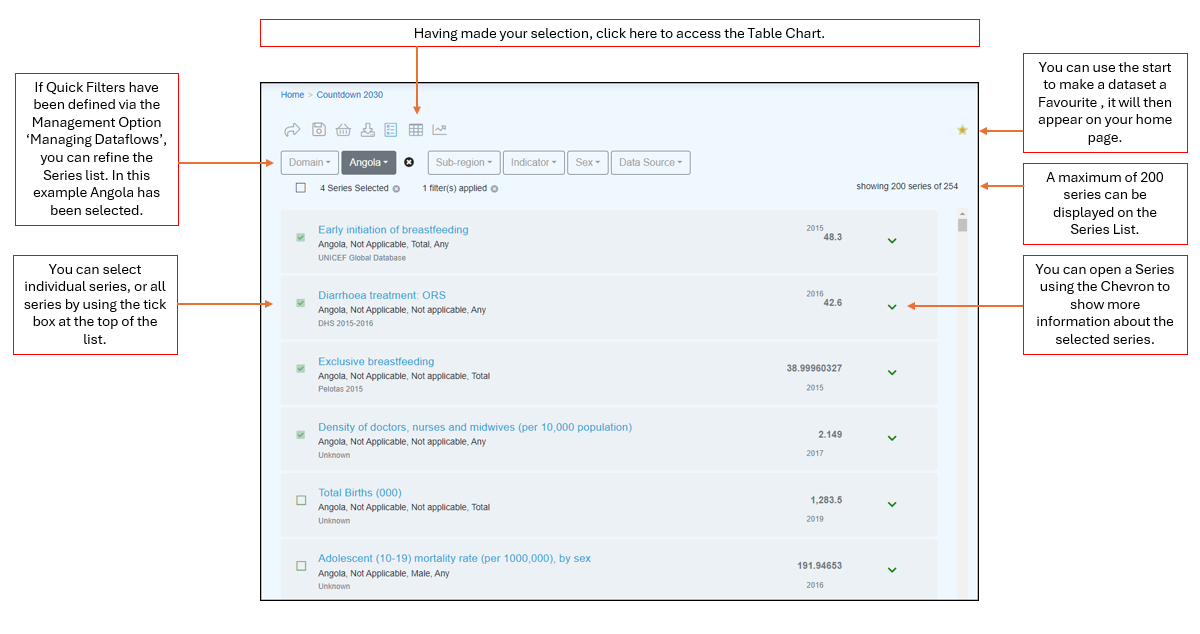
| + | To access a Table Chart you need to open a Dataset in the Series List. | ||
| − | + | ||
| + | [[File:FDB-Table-Chart1.png|1000px]] | ||
| + | |||
| + | |||
| + | The Series List allows you to define what is to be included in the Table Chart. | ||
| + | |||
| + | [[File:FDB-Table-Chart3.png|1200px]] | ||
| + | |||
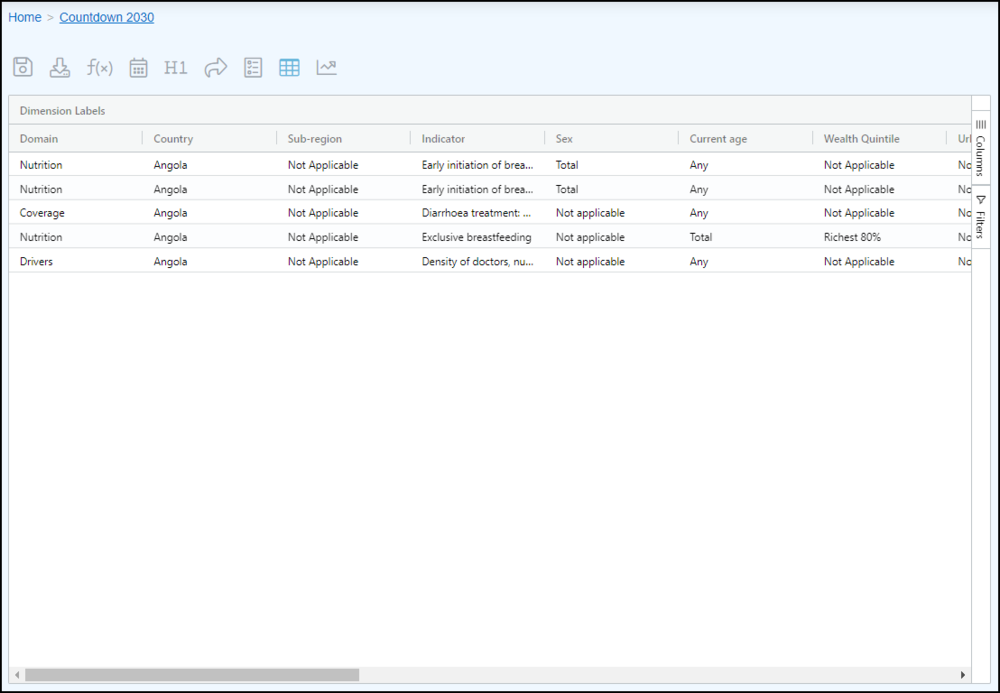
| + | Having clicked the Table button, it will open as shown in the example below. | ||
| + | |||
| + | |||
| + | [[File:FDB-Table-Chart2.png|1000px]] | ||


